DeepTrace Documentation
Welcome to the comprehensive documentation for DeepTrace - a cutting-edge, non-intrusive distributed tracing framework designed specifically for microservices architectures.
What is DeepTrace?
DeepTrace is a revolutionary distributed tracing framework that enables accurate end-to-end observation of request execution paths in microservices environments without requiring any code instrumentation. By leveraging advanced eBPF technology and intelligent transaction semantics, DeepTrace achieves over 95% tracing accuracy even under high concurrency scenarios.
Key Innovations
🚀 Non-Intrusive Design
No code changes required - DeepTrace works out of the box with your existing applications
🔍 Protocol-Aware Intelligence
Supports 20+ application protocols (HTTP, gRPC, Redis, MongoDB, etc.) with intelligent parsing
🧠 Transaction-Based Correlation
Uses dual-phase transaction inference with API affinity and persistent field similarity
⚡ High Performance
94% reduction in transmission overhead compared to traditional tracing frameworks
Architecture Overview
DeepTrace consists of two main components:
- Agent: Deployed on each host, responsible for non-intrusive request collection and span correlation through eBPF
- Server: Runs in Kubernetes clusters, handles trace assembly from correlated spans and provides query services
graph TB
    subgraph "Host 1"
        A1[Application 1]
        A2[Application 2]
        AG1[DeepTrace Agent]
        A1 --> AG1
        A2 --> AG1
    end

    subgraph "Host 2"
        A3[Application 3]
        A4[Application 4]
        AG2[DeepTrace Agent]
        A3 --> AG2
        A4 --> AG2
    end

    subgraph "DeepTrace Server Cluster"
        S[DeepTrace Server]
        DB[(Elasticsearch)]
        WEB[Web Interface]
        DB --> S
        S --> WEB
    end

    AG1 --> DB
    AG2 --> DB
Core Features
1. Protocol-Aware Span Construction
- eBPF-based packet capture for non-intrusive monitoring
- Protocol templates for accurate parsing of 20+ protocols
- Smart request boundary detection using length-field jumps and full parsing
- Efficient span creation with critical metadata extraction
2. Transaction-Based Span Correlation
- Nested API affinity: Traffic intensity correlations using Pearson coefficients
- Persistent field similarity: TF-IDF-weighted cosine similarity for transaction field isolation
- Entropy-weighted adaptive scoring: Intelligent fusion of transaction semantics and causality metrics
- 15% reduction in misattributions compared to traditional delay/FIFO methods
3. Query-Driven Trace Assembly
- On-host compression and dual-indexing for minimal overhead
- Iterative trace reconstruction based on operator queries
- Tag-based inverted indexes and metric histograms
- 94% reduction in transmission overhead while maintaining query flexibility
Quick Navigation
🚀 Getting Started
New to DeepTrace? Start here:
- Quick Start Guide - Get up and running in 10 minutes
- Installation - Detailed installation instructions
- All-in-One Deployment - Single-host setup for testing
📖 User Guide
Learn how to use DeepTrace effectively:
- Basic Usage - Essential operations and workflows
- Deployment Modes - Choose the right deployment strategy
- Trace Analysis - Analyze and interpret traces
🏗️ Architecture & Implementation
Understand how DeepTrace works:
- System Overview - High-level architecture
- eBPF Implementation - Deep dive into eBPF components
- Advanced Topics - Advanced features and algorithms
🔧 Development & Testing
For developers and contributors:
- Testing Guide - Comprehensive testing strategies
- API Reference - Complete API documentation
- Troubleshooting - Common issues and solutions
Supported Environments
DeepTrace has been tested and verified on:
- Operating System: Ubuntu 24.04 LTS
- Kernel Version: 6.8.0-55-generic or later
- Container Runtime: Docker v26.1.3+
- Orchestration: Kubernetes 1.20+
Community & Support
- GitHub Repository: DeepShield-AI/DeepTrace
- Issues & Bug Reports: GitHub Issues
- Discussions: GitHub Discussions
License
DeepTrace is released under the MIT License.
Quick Start Guide
Get DeepTrace up and running in just 10 minutes! This guide will walk you through the fastest way to deploy DeepTrace and start collecting traces from your applications.
Prerequisites
Before you begin, ensure you have:
- Ubuntu 24.04 LTS (or compatible Linux distribution)
- Kernel version 4.7.0+ with eBPF support
- Docker 26.1.3+ installed and running
- 40GB+ free disk space
- Root/sudo access
- Internet connectivity
Step 1: Clone the Repository
git clone https://github.com/DeepShield-AI/DeepTrace.git
cd DeepTrace
⚠️ Important: Do not clone into
/etcdirectory as the agent will use this path later.
Step 2: Quick Configuration
- To deploy DeepTrace, you must fill in the following fields in the
server/config/config.tomlin order to run it. These required fields are presented in the configuration file in the format of xxx. In all-in-one mode, theserver.ipandagents.agent_info.host_ipvalues are identical.
Edit the configuration file and fill in these required fields:
| Configuration Item | Description |
|---|---|
server.ip | The external IP address of the host running the DeepTrace server and the Elastic database |
elastic.elastic_password | Password for Elastic |
agents.agent_info.agent_name | Name of the agent, which uniquely identifies each agent instance |
agents.agent_info.user_name | The username for logging into the host where the agent is located via SSH |
agents.agent_info.host_ip | IP address of the agent host |
agents.agent_info.ssh_port | SSH port of the agent host (usually 22) |
agents.agent_info.host_password | The password for logging into the host where the agent is located via SSH |
Step 3: Deploy DeepTrace Server
Launch the DeepTrace server and Elasticsearch database:
sudo bash scripts/deploy_server.sh
This command will:
- Pull required Docker images
- Start Elasticsearch database
- Launch DeepTrace server
- Set up the web interface
Verify deployment:
sudo docker ps | grep deeptrace
You should see containers running for deeptrace_server and elasticsearch.
Step 4: Access Elasticsearch Web Interface
Open your browser and navigate to:
http://YOUR_SERVER_IP:5601
Login credentials:
- Username:
elastic - Password:
YOUR_ELASTIC_PASSWORD(from Step 2)
Step 5: Deploy a Microservice Application
To generate traces, deploy a test microservice application:
Choose an application: See Workload Applications for detailed deployment instructions.
Step 6: Install and Start Agent
Install the DeepTrace agent on your host:
# Install agent (compiles from source)
sudo docker exec -it deeptrace_server python -m cli.src.cmd agent install

# Start collecting traces
sudo docker exec -it deeptrace_server python -m cli.src.cmd agent run
The agent will automatically:
- Compile eBPF programs
- Start monitoring all Docker containers
- Begin collecting network traces
- Send data to the server
Step 7: Generate Sample Traffic
Generate traffic to your deployed microservice application:
Follow the traffic generation instructions in Workload Applications for your chosen application.
Step 8: Build and View Traces
Correlate spans and assemble traces:
# Perform span correlation using DeepTrace algorithm
sudo docker exec -it deeptrace_server python -m cli.src.cmd asso algo deeptrace

# Assemble traces from correlated spans
sudo docker exec -it deeptrace_server python -m cli.src.cmd assemble
Step 9: Explore Your Traces
- Elasticsearch Web Interface: Visit
http://YOUR_SERVER_IP:5601 - Navigate to Discover: Click on "Discover" in the left sidebar
- Select Index: Choose the trace index pattern
- View Traces: Explore collected traces with rich metadata
Verification Checklist
✅ Server Running: sudo docker ps | grep deeptrace_server
✅ Agent Connected: Check agent status in web interface
✅ Traces Collected: Verify traces appear in Elasticsearch
✅ Elasticsearch Web Interface Accessible: Can login and view data
Clean Up
To remove DeepTrace and all components:
sudo bash scripts/clear.sh
This will stop and remove all containers, networks, and temporary files.
Next Steps
Congratulations! You now have DeepTrace running and collecting traces. Here's what to explore next:
- Configuration Guide: Customize DeepTrace for your environment
- Basic Usage: Learn essential operations
- Architecture Overview: Understand how DeepTrace works
- Troubleshooting: Resolve common issues
Need Help?
- Common Issues: Check our troubleshooting guide
- GitHub Issues: Report bugs or ask questions
- Documentation: Explore the full documentation
Installation Guide
This guide provides comprehensive installation instructions for DeepTrace. Choose the installation method that best fits your environment and requirements.
Installation Methods
DeepTrace can be installed using two primary methods:
-
Docker Installation (Recommended)
- Fastest and most reliable method
- Pre-built environment with all dependencies
- Ideal for production deployments
-
- Build from source code
- Full control over compilation process
- Required for custom modifications
System Requirements
Minimum Requirements
| Component | Requirement |
|---|---|
| Operating System | Ubuntu 24.04 LTS (or compatible) |
| Kernel Version | 4.7.0+ with eBPF support |
| Memory | 8GB recommended |
| Storage | 40GB free disk space |
| CPU | 2 cores minimum, 4+ recommended |
| Network | Internet connectivity for downloads |
Software Dependencies
- Docker: v26.1.3 or later
- Container Runtime: Docker Engine or compatible
- Shell: Bash 4.0+
- Privileges: Root or sudo access
Kernel Requirements
DeepTrace requires specific kernel features:
# Check kernel version
uname -r

# Verify eBPF support
zgrep CONFIG_BPF /proc/config.gz
zgrep CONFIG_BPF_SYSCALL /proc/config.gz
zgrep CONFIG_BPF_JIT /proc/config.gz
All should return =y or =m.
Pre-Installation Checklist
Before installing DeepTrace, verify your system meets all requirements:
1. System Compatibility
# Check OS version
lsb_release -a

# Check available disk space
df -h

# Check memory
free -h

# Verify Docker installation
sudo docker --version
2. Network Configuration
# Test internet connectivity
ping -c 3 github.com

# Check if required ports are available
netstat -tuln | grep -E ':(5601|7901|9200|52001)'
3. Permissions
# Verify sudo access
sudo whoami

# Check Docker permissions
sudo docker ps
Installation Overview
The installation process involves several key steps:
- Environment Setup: Prepare the host system
- Repository Clone: Download DeepTrace source code
- Configuration: Set up configuration files
- Server Deployment: Install server components
- Agent Installation: Deploy monitoring agents
- Verification: Confirm successful installation
Quick Installation
For users who want to get started immediately:
# Clone repository
git clone https://github.com/DeepShield-AI/DeepTrace.git
cd DeepTrace

# Quick setup with Docker (recommended)
sudo bash scripts/install_agent.sh
This script will:
- Pull necessary Docker images
- Set up basic configuration
- Deploy agent component
Deployment Modes
DeepTrace supports multiple deployment configurations:
Single Host (All-in-One)
- Server and agent on the same machine
- Ideal for testing and small deployments
- Simplified configuration and management
Distributed Deployment
- Server cluster with multiple agents
- Production-ready scalability
- Advanced configuration options
Post-Installation
After successful installation:
- Verify Services: Ensure all components are running
- Access Elasticsearch Web Interface: Connect to the management dashboard
- Test Functionality: Generate sample traces
Troubleshooting Installation
Common installation issues and solutions:
Docker Issues
# Fix Docker permissions
sudo usermod -aG docker $USER
newgrp docker

# Restart Docker service
sudo systemctl restart docker
Port Conflicts
# Check port usage
sudo netstat -tuln | grep :PORT_NUMBER

# Kill conflicting processes
sudo fuser -k PORT_NUMBER/tcp
Insufficient Resources
# Check system resources
htop
df -h
free -h

# Clean up disk space
docker system prune -a
Next Steps
After installation, proceed to:
- Configuration Guide: Customize your deployment
- Quick Start: Begin collecting traces
- Basic Usage: Learn essential operations
Support
If you encounter issues during installation:
- Check Prerequisites: Verify all requirements are met
- Review Logs: Examine installation logs for errors
- Consult Documentation: Check specific installation method guides
- Community Support: Visit our GitHub Issues
Docker Installation
The Docker installation method is the recommended approach for deploying DeepTrace. It provides a pre-configured environment with all dependencies, ensuring consistent and reliable deployments across different systems.
Prerequisites
System Requirements
- Ubuntu 24.04 LTS (or compatible Linux distribution)
- Kernel 4.7.0+ with eBPF support
- 40GB+ free disk space
- 8GB+ RAM
- Internet connectivity
Docker Installation
If Docker is not already installed, you can install Docker by following the official instructions: Docker Installation
1. Verify Docker Installation
# Check Docker version
sudo docker --version

# Test Docker installation
sudo docker run hello-world
DeepTrace Docker Installation
Step 1: Clone Repository
git clone https://github.com/DeepShield-AI/DeepTrace.git
cd DeepTrace
⚠️ Important: Do not clone into
/etcdirectory as the agent will use this path during deployment.
Step 2: Configure Docker Registry
DeepTrace uses a private Docker registry for pre-built images. Configure Docker to access it:
Edit Docker Daemon Configuration
sudo nano /etc/docker/daemon.json
Add the following configuration:
{
  "insecure-registries": ["47.97.67.233:5000"]
}
Note: This configuration allows HTTP connections to the private registry.
Restart Docker Service
sudo systemctl daemon-reload
sudo systemctl restart docker
Step 3: Pull DeepTrace Images
# Pull the main DeepTrace image
sudo docker pull 47.97.67.233:5000/deepshield/deeptrace:latest

# Verify image download
sudo docker images | grep deeptrace
Step 4: Compile Agent
Use the Docker container to compile the DeepTrace agent:
# Navigate to DeepTrace directory
cd DeepTrace

# Compile using Docker container
sudo docker run --privileged --rm -it \
  -v $(pwd):/DeepTrace \
  47.97.67.233:5000/deepshield/deeptrace:latest \
  bash -c 'cd /DeepTrace/agent && cargo xtask build --profile release'
This command will:
- Mount your local DeepTrace directory into the container
- Compile the agent with release optimizations
- Generate the binary at
agent/target/x86_64-unknown-linux-gnu/release/deeptrace
Step 5: Configure DeepTrace
# Copy example configuration
cd agent
cp config/deeptrace.toml.example config/deeptrace.toml

# Edit configuration file
nano config/deeptrace.toml
Update the configuration with your specific settings. See the Configuration Guide for detailed options.
Step 6: Test Agent
# Test the compiled agent
sudo RUST_LOG=info ./target/x86_64-unknown-linux-gnu/release/deeptrace -c config/deeptrace.toml
Verification
1. Verify Agent Compilation
# Check if agent binary exists
ls -la target/x86_64-unknown-linux-gnu/release/deeptrace

# Test agent help
./target/x86_64-unknown-linux-gnu/release/deeptrace --help
Troubleshooting
Common Docker Issues
Permission Denied
# Add user to docker group
sudo usermod -aG docker $USER
newgrp docker
Port Already in Use
# Check what's using the port
sudo netstat -tuln | grep :5601

# Kill the process
sudo fuser -k 5601/tcp
Image Pull Failures
# Check Docker daemon configuration
sudo systemctl status docker

# Restart Docker
sudo systemctl restart docker

# Try pulling again
docker pull 47.97.67.233:5000/deepshield/deeptrace:latest
Compilation Errors
# Check available disk space
df -h

# Clean Docker cache
docker system prune -a

# Retry compilation with verbose output
sudo docker run --privileged --rm -it \
  -v $(pwd):/DeepTrace \
  47.97.67.233:5000/deepshield/deeptrace:latest \
  bash -c 'cd /DeepTrace/agent && RUST_LOG=debug cargo xtask build --profile release'
Resource Issues
Insufficient Memory
# Check memory usage
free -h

# Increase Docker memory limit (if using Docker Desktop)
# Go to Docker Desktop Settings > Resources > Memory
Disk Space
# Clean up Docker resources
sudo docker system prune -a --volumes

# Remove unused images
sudo docker image prune -a
Next Steps
After successful Docker installation:
- Configuration: Customize your deployment
- All-in-One Deployment: Quick setup for testing
- Basic Usage: Start using DeepTrace
Alternative: Manual Compilation
If you prefer to compile from source without Docker, see the Manual Compilation Guide.
Manual Compilation
This guide walks you through compiling DeepTrace from source code. Manual compilation gives you full control over the build process and is required for custom modifications or when Docker is not available.
When to Use Manual Compilation
Choose manual compilation when you need to:
- Customize the build process or modify source code
- Work in environments where Docker is not available
- Understand the dependencies and build process in detail
- Optimize for specific hardware or kernel configurations
💡 Tip: For most users, the Docker installation method is faster and more reliable.
Prerequisites
System Requirements
- Ubuntu 24.04 LTS (recommended) or compatible Linux distribution
- Kernel 4.7.0+ with eBPF support and BTF information
- 20GB+ free disk space
- 8GB+ RAM
- Internet connectivity for downloading dependencies
Required Packages
The following packages must be installed before compilation:
# Update package lists
sudo apt-get update

# Install essential build tools
sudo apt-get install -y --no-install-suggests --no-install-recommends \
  build-essential \
  clang \
  llvm-18 \
  llvm-18-dev \
  llvm-18-tools \
  curl \
  ca-certificates \
  git \
  make \
  libelf-dev \
  libclang-18-dev \
  pkg-config \
  libssl-dev \
  openssl
Step-by-Step Installation
Step 1: Set Up Environment Variables
Configure LLVM environment variables for the build process:
# Set LLVM paths
export LLVM_PATH=/lib/llvm-18
export PATH=$PATH:/lib/llvm-18/bin

# Make changes persistent
echo "export LLVM_PATH=/lib/llvm-18" >> ~/.bashrc
echo "export PATH=\$PATH:/lib/llvm-18/bin" >> ~/.bashrc
source ~/.bashrc

# Verify LLVM installation
llvm-config-18 --version
clang-18 --version
Step 2: Build and Install libbpf
DeepTrace requires libbpf for eBPF functionality:
# Clone libbpf repository
git clone https://github.com/libbpf/libbpf.git --branch libbpf-1.6.2 --depth 1
cd libbpf/src

# Build with static linking only
BUILD_STATIC_ONLY=y make -j$(nproc)

# Install system-wide
sudo make install

# Update library cache
sudo ldconfig

# Verify installation
pkg-config --modversion libbpf
Step 3: Install Rust Toolchain
DeepTrace is written in Rust and requires specific toolchain components:
# Install Rust using rustup
curl --proto '=https' --tlsv1.2 -sSf https://sh.rustup.rs | sh -s -- -y --default-toolchain=stable

# Add Rust to PATH
echo "export PATH=\$PATH:\$HOME/.cargo/bin" >> ~/.bashrc
source ~/.bashrc

# Verify Rust installation
rustc --version
cargo --version
Step 4: Configure Rust for eBPF Development
Install additional Rust components needed for eBPF compilation:
# Add Rust source code (required for eBPF)
rustup component add rust-src

# Install nightly toolchain with rust-src
rustup toolchain install nightly --component rust-src

# Add target for cross-compilation (if needed)
rustup target add aarch64-unknown-linux-gnu

# Install BPF linker
cargo install bpf-linker

# Verify BPF linker installation
bpf-linker --version
Step 5: Clone DeepTrace Repository
# Clone the repository
git clone https://github.com/DeepShield-AI/DeepTrace.git
cd DeepTrace

# Check repository structure
ls -la
Step 6: Compile DeepTrace
Now compile the DeepTrace agent with optimizations:
cd agent

# Compile with release profile for optimal performance
cargo xtask build --profile release

# The compilation process will:
# 1. Build eBPF programs
# 2. Compile Rust userspace components
# 3. Link everything together
Expected compilation time: 10-30 minutes depending on your hardware.
Step 7: Verify Compilation
Check that the compilation was successful:
# Verify agent binary exists
ls -la target/x86_64-unknown-linux-gnu/release/deeptrace

# Check binary size and permissions
file target/x86_64-unknown-linux-gnu/release/deeptrace

# Test help output
./target/x86_64-unknown-linux-gnu/release/deeptrace --help
Step 8: Set Up Configuration
# Copy example configuration
cp config/deeptrace.toml.example config/deeptrace.toml

# Edit configuration as needed
nano config/deeptrace.toml
Step 9: Test the Agent
Run a basic test to ensure the agent works correctly:
# Test with info logging
RUST_LOG=info cargo xtask run -c config/deeptrace.toml

# Or run the binary directly
sudo RUST_LOG=info ./target/x86_64-unknown-linux-gnu/release/deeptrace -c config/deeptrace.toml
Advanced Build Options
Debug Build
For development and debugging:
# Build with debug symbols
cargo xtask build --profile debug

# Run with debug logging
RUST_LOG=debug cargo xtask run -c config/deeptrace.toml
Custom Features
Enable or disable specific features:
# Build with specific features
# todo: feature is currently not supported
cargo xtask build --profile release --features "feature1,feature2"

# Build without default features
cargo xtask build --profile release --no-default-features
Cross-Compilation
For different architectures:
# Add target architecture
rustup target add aarch64-unknown-linux-gnu

# Cross-compile for ARM64
cargo xtask build --profile release --target aarch64-unknown-linux-gnu
Troubleshooting Compilation Issues
Common Build Errors
LLVM/Clang Issues
# Verify LLVM installation
which clang-18
llvm-config-18 --version

# Reinstall if necessary
sudo apt-get install --reinstall llvm-18 clang-18
libbpf Linking Errors
# Check libbpf installation
pkg-config --libs libbpf

# Rebuild libbpf if necessary
cd libbpf/src
make clean
BUILD_STATIC_ONLY=y make -j$(nproc)
sudo make install
sudo ldconfig
Rust Compilation Errors
# Update Rust toolchain
rustup update

# Clean build cache
cargo clean

# Rebuild with verbose output
cargo xtask build --profile release -- --verbose
eBPF Compilation Errors
# Check kernel headers
ls /usr/src/linux-headers-$(uname -r)/

# Install kernel headers if missing
sudo apt-get install linux-headers-$(uname -r)

# Verify BTF support
ls /sys/kernel/btf/vmlinux
Memory Issues During Compilation
If compilation fails due to insufficient memory:
# Check available memory
free -h

# Reduce parallel jobs
cargo xtask build --profile release -j 1

# Or increase swap space
sudo fallocate -l 4G /swapfile
sudo chmod 600 /swapfile
sudo mkswap /swapfile
sudo swapon /swapfile
Disk Space Issues
# Check available space
df -h

# Clean Rust cache
cargo clean

# Remove target directory
rm -rf target/

# Clean package cache
sudo apt-get clean
Development Setup
For ongoing development work:
# Install development tools
cargo install cargo-watch cargo-expand

# Set up pre-commit hooks
git config core.hooksPath .githooks

# Run tests
cargo test

# Format code
cargo +nightly fmt

# Run linter
cargo xtask clippy
Next Steps
After successful manual compilation:
- Configuration Guide: Set up your deployment
- Testing Guide: Verify your build
- Development Setup: Set up for development
References
- Ubuntu Installation Guide
- LLVM Documentation
- libbpf GitHub Repository
- Rust Installation Guide
- Aya eBPF Framework
- BPF Linker Documentation
Configuration Guide
This comprehensive guide covers all aspects of configuring DeepTrace for your specific environment and requirements. DeepTrace consists of two main components that require separate configuration: the Server and the Agent.
Configuration Overview
DeepTrace uses TOML configuration files to manage settings. The configuration system is designed to be:
- Simple: Straightforward configuration structure
- Flexible: Support for multiple deployment scenarios
- Secure: Sensitive information can be externalized
- Validated: Configuration is checked at startup
Configuration Files
DeepTrace provides several configuration files:
- Server:
server/config/config.toml- Server and agent management configuration - Agent:
agent/config/deeptrace.toml- Agent-side configuration (current) - Agent Template:
agent/config/deeptrace.toml.example- Agent configuration template - Prism:
agent/config/prism.toml- Lightweight monitoring configuration
Server Configuration
The server configuration manages the DeepTrace server, Elasticsearch integration, and agent deployment settings. The main configuration file is located at server/config/config.toml.
Required Server Configuration
The server configuration is simple and requires only essential fields:
Server Settings
[server]
# External IP address of the DeepTrace server (REQUIRED)
ip = "192.168.1.100"  # Replace with your server's IP
Elasticsearch Configuration
[elastic]
# Elasticsearch password (REQUIRED - choose a secure password)
elastic_password = "your_secure_password_here"
Agent Management Configuration
The server manages agent deployments through SSH connections:
Single Agent Configuration
[[agents]]
  [agents.agent_info]
  # Unique identifier for this agent (REQUIRED)
  agent_name = "agent-1"

  # SSH connection details (ALL REQUIRED)
  user_name = "ubuntu"              # SSH username
  host_ip = "192.168.1.101"        # Agent host IP
  ssh_port = 22                     # SSH port (usually 22)
  host_password = "ssh_password"    # SSH password (consider using SSH keys)
Multiple Agents Configuration
# Agent 1 - Web servers
[[agents]]
  [agents.agent_info]
  agent_name = "agent-1"
  user_name = "ubuntu"
  host_ip = "192.168.1.101"
  ssh_port = 22
  host_password = "password1"

# Agent 2 - Database servers
[[agents]]
  [agents.agent_info]
  agent_name = "agent-2"
  user_name = "ubuntu"
  host_ip = "192.168.1.102"
  ssh_port = 22
  host_password = "password2"

# Agent 3 - Cache servers
[[agents]]
  [agents.agent_info]
  agent_name = "agent-3"
  user_name = "ubuntu"
  host_ip = "192.168.1.103"
  ssh_port = 22
  host_password = "password3"
Agent Configuration
The agent configuration defines how the DeepTrace agent operates on target systems. The main configuration file is agent/config/deeptrace.toml.
Required Agent Configuration
Basic Agent Settings
[agent]
name = "deeptrace"                # Agent identifier (required)
Configuration Modules
Metric Collection Configuration
[metric]
interval = 10                     # Metric collection interval (seconds)
sender = "metric"                 # Sender configuration name for metrics
Data Sending Configuration
File-based Storage for Metrics
[sender.file.metric]
path = "metrics.csv"              # File path for metrics storage
rotate = true                     # Enable file rotation
max_size = 512                    # Maximum file size (MB)
max_age = 7                       # Maximum retention (days)
rotate_time = 10                  # Rotation interval (days)
data_format = "%Y%m%d"            # Timestamp format for rotation
Elasticsearch Sender for Traces
[sender.elastic.trace]
node_urls = "http://localhost:9200"      # Elasticsearch URL
username = "elastic"                     # Elasticsearch username
password = "your_password"               # Elasticsearch password
request_timeout = 10                     # Request timeout (seconds)
index_name = "agent1"                    # Index name for this agent
bulk_size = 32                           # Bulk operation size
Tracing Configuration
[trace]
ebpf = "trace"                    # eBPF configuration name for tracing
sender = "trace"                  # Sender configuration name for traces

[trace.span]
cleanup_interval = 30             # Cleanup interval for expired spans (seconds)
max_sockets = 1024                # Maximum tracked socket count
eBPF Configuration
[ebpf.trace]
log_level = 1                     # Log level: 0=off, 1=debug, 3=verbose, 4=stats
pids = [523094]                   # Process IDs to monitor (specific PIDs)
max_buffered_events = 128         # Maximum events processed per batch
enabled_probes = [                # List of enabled system call probes
    "sys_enter_read",
    "sys_exit_read",
    "sys_enter_readv",
    "sys_exit_readv",
    "sys_enter_recvfrom",
    "sys_exit_recvfrom",
    "sys_enter_recvmsg",
    "sys_exit_recvmsg",
    "sys_enter_recvmmsg",
    "sys_exit_recvmmsg",
    "sys_enter_write",
    "sys_exit_write",
    "sys_enter_writev",
    "sys_exit_writev",
    "sys_enter_sendto",
    "sys_exit_sendto",
    "sys_enter_sendmsg",
    "sys_exit_sendmsg",
    "sys_enter_sendmmsg",
    "sys_exit_sendmmsg",
    "sys_exit_socket",
    "sys_enter_close"
]
Complete Configuration Examples
Full-Featured Agent Configuration
[agent]
name = "production-agent"

[metric]
interval = 5
sender = "metric"

[sender.file.metric]
path = "/var/log/deeptrace/metrics.csv"
rotate = true
max_size = 256
max_age = 30
rotate_time = 7
data_format = "%Y%m%d"

[sender.elastic.trace]
node_urls = "http://prod-elastic:9200"
username = "elastic"
password = "prod_password"
request_timeout = 30
index_name = "production_traces"
bulk_size = 64

[trace]
ebpf = "trace"
sender = "trace"

[trace.span]
cleanup_interval = 30
max_sockets = 10000

[ebpf.trace]
log_level = 1
enabled_probes = [
    "sys_enter_read",
    "sys_exit_read",
    "sys_enter_recvfrom",
    "sys_exit_recvfrom",
    "sys_enter_write",
    "sys_exit_write",
    "sys_enter_sendto",
    "sys_exit_sendto",
    "sys_exit_socket",
    "sys_enter_close"
]
max_buffered_events = 256
pids = []  # Monitor no processes
Troubleshooting Configuration
Common Server Issues
Configuration File Not Found
# Check file exists and permissions
ls -la server/config/config.toml
chmod 644 server/config/config.toml
Invalid TOML Syntax
# Validate TOML syntax
python3 -c "import toml; toml.load('server/config/config.toml')"
Agent Connection Issues
# Test SSH connectivity to agent
ssh ubuntu@192.168.1.101 -p 22

# Test DeepTrace server port
telnet 192.168.1.100 7901
Common Agent Issues
Configuration Loading Errors
# Check agent configuration syntax
cd agent/config
python3 -c "import toml; toml.load('deeptrace.toml')"
Network Connectivity
# Test server connectivity
telnet 192.168.1.100 7901

# Test Elasticsearch connectivity
curl http://192.168.1.100:9200/_cluster/health
Permission Issues
# Check eBPF capabilities
sudo setcap cap_sys_admin,cap_net_admin,cap_bpf+ep /path/to/deeptrace

# Check file permissions
ls -la agent/config/deeptrace.toml
chmod 644 agent/config/deeptrace.toml
Next Steps
After configuring DeepTrace:
- All-in-One Deployment: Deploy for testing
- Basic Usage: Start using DeepTrace
- Troubleshooting: Resolve issues
All-in-One Deployment
All-in-one deployment runs both the DeepTrace server and agent on a single host. This is the recommended starting point for new users.
🚀 Ready to start? Follow the Quick Start Guide for complete step-by-step instructions.
What is All-in-One Mode?
In all-in-one deployment, all DeepTrace components run on the same host:
┌─────────────────────────────────────────────────┐
│              Single Host (All-in-One)           │
│                                                 │
│  ┌──────────────┐      ┌──────────────┐       │
│  │  DeepTrace   │◄────►│ Elasticsearch│       │
│  │   Server     │      │   Database   │       │
│  └──────────────┘      └──────────────┘       │
│         ▲                                      │
│         │                                      │
│         ▼                                      │
│  ┌──────────────┐      ┌──────────────┐       │
│  │  DeepTrace   │◄────►│ Microservice │       │
│  │    Agent     │      │     Apps     │       │
│  └──────────────┘      └──────────────┘       │
│                                                 │
└─────────────────────────────────────────────────┘
Key Benefits
- Simple Setup: Single command deployment
- Quick Learning: Understand all components on one host
- Easy Testing: Perfect for evaluation and development
- Minimal Resources: Requires only one host
Requirements
- OS: Ubuntu 24.04 LTS
- Memory: 8GB RAM minimum
- Storage: 40GB free space
- Docker: v26.1.3+
Key Configuration Note
In all-in-one mode, the server and agent IPs must be identical:
[server]
ip = "192.168.1.100"              # Your host IP

[[agents]]
  [agents.agent_info]
  host_ip = "192.168.1.100"       # Same as server.ip
Next Steps
- Quick Start Guide - Complete deployment walkthrough
- Configuration Guide - Detailed configuration options
For production deployments, see Deployment Modes.
Basic Usage
This guide covers essential operations for using DeepTrace after completing the initial setup. It focuses on day-to-day operations and advanced usage patterns.
Prerequisites: Complete the Quick Start Guide before using this guide.
Core Workflow
DeepTrace follows a simple workflow for distributed tracing:
1. Agent Collection → 2. Span Correlation → 3. Trace Assembly → 4. Analysis
Advanced Agent Operations
Agent Status Management
# Check agent status
sudo docker exec -it deeptrace_server python -m cli.src.cmd agent status

# Restart agent with new configuration
sudo docker exec -it deeptrace_server python -m cli.src.cmd agent restart

# View agent logs
sudo docker exec -it deeptrace_server python -m cli.src.cmd agent logs
Span Correlation
Available Algorithms
| Algorithm | Description | Use Case |
|---|---|---|
deeptrace | Advanced transaction-based correlation | Recommended for most scenarios |
fifo | Simple first-in-first-out correlation | Testing and simple applications |
Run Correlation
# Use DeepTrace algorithm (recommended)
sudo docker exec -it deeptrace_server python -m cli.src.cmd asso algo deeptrace

# Alternative: Use FIFO algorithm
sudo docker exec -it deeptrace_server python -m cli.src.cmd asso algo fifo
Trace Assembly
After correlation, assemble traces from correlated spans:
# Assemble traces
sudo docker exec -it deeptrace_server python -m cli.src.cmd assemble
Advanced Data Analysis
For basic trace viewing, see the Quick Start Guide. This section covers advanced analysis techniques.
Advanced Kibana Operations
# Create custom index patterns
# Set up advanced visualizations
# Configure dashboards for monitoring
For detailed analysis techniques, see Trace Analysis.
System Monitoring
Health Checks
# Check Elasticsearch cluster health
curl http://localhost:9200/_cluster/health

# Monitor container resource usage
sudo docker stats

# Verify DeepTrace containers
sudo docker ps | grep deeptrace
Data Management
# Clear all collected data
sudo docker exec -it deeptrace_server python -m cli.src.cmd db clear

# Delete specific Elasticsearch index
curl -X DELETE "localhost:9200/traces"
Troubleshooting
No Traces Collected
Common causes and solutions:
- Agent not running: Verify agent status and restart if needed
- No traffic: Ensure microservice applications are receiving requests
- Network issues: Check connectivity between agent and server
- Elasticsearch issues: Verify Elasticsearch is accessible and healthy
Poor Correlation Results
Optimization strategies:
- Try different algorithms: Switch between
deeptraceandfifo - Increase data collection: Ensure sufficient spans before correlation
- Check application traffic: Verify microservices are generating network activity
- Review configuration: Ensure proper agent and server configuration
Cleanup
Remove DeepTrace
To completely remove DeepTrace and all components:
sudo bash scripts/clear.sh
This will:
- Stop all containers
- Remove Docker images
- Clean up temporary files
- Reset the environment
Next Steps
- Web UI: Explore the web-based monitoring interface
- Database Setup: Advanced Elasticsearch configuration
- Workload Applications: Deploy additional test applications
- Configuration Guide: Advanced configuration options
Deployment Modes
DeepTrace supports different deployment modes to accommodate various use cases, from development and testing to production environments.
Available Deployment Modes
| Mode | Description | Use Case | Complexity |
|---|---|---|---|
| All-in-One | Single host deployment | Development, testing, learning | Simple |
| Distributed | Multi-host deployment | Production, large scale | Advanced |
All-in-One Mode
For complete all-in-one setup, see the All-in-One Deployment Guide and Quick Start Guide.
Key Characteristics
- Single host runs all components
- Simplified configuration and management
- Perfect for learning and development
- Limited scalability
Distributed Mode
Overview
Distributed deployment separates DeepTrace components across multiple hosts for production environments. This mode provides:
- Scalability: Handle large-scale distributed systems
- High Availability: Redundancy and fault tolerance
- Performance: Distributed processing and storage
- Flexibility: Independent scaling of components
Architecture
┌─────────────────┐    ┌─────────────────┐    ┌─────────────────┐
│   Server Host   │    │   Agent Host 1  │    │   Agent Host 2  │
│                 │    │                 │    │                 │
│ ┌─────────────┐ │    │ ┌─────────────┐ │    │ ┌─────────────┐ │
│ │ DeepTrace   │ │    │ │ DeepTrace   │ │    │ │ DeepTrace   │ │
│ │   Server    │◄┼────┼►│   Agent     │ │    │ │   Agent     │ │
│ └─────────────┘ │    │ └─────────────┘ │    │ └─────────────┘ │
│ ┌─────────────┐ │    │ ┌─────────────┐ │    │ ┌─────────────┐ │
│ │Elasticsearch│ │    │ │Microservices│ │    │ │Microservices│ │
│ │  Database   │ │    │ │    Apps     │ │    │ │    Apps     │ │
│ └─────────────┘ │    │ └─────────────┘ │    │ └─────────────┘ │
└─────────────────┘    └─────────────────┘    └─────────────────┘
Configuration
For distributed deployment, configure multiple agents in server/config/config.toml:
[server]
ip = "192.168.1.100"  # Server host IP

[[agents]]
  [agents.agent_info]
  agent_name = "agent-1"
  host_ip = "192.168.1.101"    # Different from server IP
  user_name = "ubuntu"
  ssh_port = 22
  host_password = "password"

[[agents]]
  [agents.agent_info]
  agent_name = "agent-2"
  host_ip = "192.168.1.102"    # Another host
  user_name = "ubuntu"
  ssh_port = 22
  host_password = "password"
Deployment Steps
- Configure server: Set up server configuration with multiple agents
- Deploy server: Run server on designated host
- Install agents: Deploy agents on target hosts
- Verify connectivity: Ensure all agents can communicate with server
- Start monitoring: Begin collecting traces across all hosts
Choosing the Right Mode
All-in-One Mode
Choose when:
- Learning DeepTrace functionality
- Developing and testing applications
- Demonstrating tracing capabilities
- Working with small-scale systems
Limitations:
- Limited to single host resources
- Not suitable for production
- No high availability
Distributed Mode
Choose when:
- Deploying to production
- Monitoring large-scale systems
- Requiring high availability
- Need independent scaling
Considerations:
- More complex setup and maintenance
- Requires network configuration
- Higher resource requirements
Next Steps
- All-in-One: Start with Quick Start Guide
- Distributed: Review Configuration Guide
- Basic Usage: Learn essential operations
- Database Setup: Configure Elasticsearch clusters
Distributed Mode
Distributed deployment separates DeepTrace components across multiple hosts for production environments. This mode provides scalability, high availability, and performance for large-scale distributed systems.
Architecture Overview
┌─────────────────┐    ┌─────────────────┐    ┌─────────────────┐
│   Server Host   │    │   Agent Host 1  │    │   Agent Host 2  │
│                 │    │                 │    │                 │
│ ┌─────────────┐ │    │ ┌─────────────┐ │    │ ┌─────────────┐ │
│ │ DeepTrace   │ │    │ │ DeepTrace   │ │    │ │ DeepTrace   │ │
│ │   Server    │◄┼────┼►│   Agent     │ │    │ │   Agent     │ │
│ └─────────────┘ │    │ └─────────────┘ │    │ └─────────────┘ │
│ ┌─────────────┐ │    │ ┌─────────────┐ │    │ ┌─────────────┐ │
│ │Elasticsearch│ │    │ │Microservices│ │    │ │Microservices│ │
│ │  Database   │ │    │ │    Apps     │ │    │ │    Apps     │ │
│ └─────────────┘ │    │ └─────────────┘ │    │ └─────────────┘ │
└─────────────────┘    └─────────────────┘    └─────────────────┘
Key Benefits
- Scalability: Handle large-scale distributed systems
- High Availability: Redundancy and fault tolerance
- Performance: Distributed processing and storage
- Flexibility: Independent scaling of components
Configuration
Configure multiple agents in server/config/config.toml:
[server]
ip = "192.168.1.100"  # Server host IP

[[agents]]
  [agents.agent_info]
  agent_name = "agent-1"
  host_ip = "192.168.1.101"    # Different from server IP
  user_name = "ubuntu"
  ssh_port = 22
  host_password = "password"

[[agents]]
  [agents.agent_info]
  agent_name = "agent-2"
  host_ip = "192.168.1.102"    # Another host
  user_name = "ubuntu"
  ssh_port = 22
  host_password = "password"
Deployment Steps
- Configure server: Set up server configuration with multiple agents
- Deploy server: Run server on designated host
- Install agents: Deploy agents on target hosts
- Verify connectivity: Ensure all agents can communicate with server
- Start monitoring: Begin collecting traces across all hosts
Requirements
- Multiple hosts: At least 2 hosts (1 server + 1+ agents)
- Network connectivity: All hosts must communicate
- SSH access: Server needs SSH access to agent hosts
- Resources: Varies by scale and workload
Use Cases
Choose distributed mode when:
- Deploying to production
- Monitoring large-scale systems
- Requiring high availability
- Need independent scaling
Considerations
- More complex setup and maintenance
- Requires network configuration
- Higher resource requirements
- Need proper security configuration
Next Steps
- Configuration Guide: Detailed configuration options
- Basic Usage: Learn essential operations
- Database Management: Configure Elasticsearch clusters
Single Host Mode
Single host mode (also known as All-in-One mode) runs both the DeepTrace server and agent on a single host. This is the recommended starting point for new users and ideal for development, testing, and learning.
Architecture Overview
┌─────────────────────────────────────────────────┐
│              Single Host (All-in-One)           │
│                                                 │
│  ┌──────────────┐      ┌──────────────┐       │
│  │  DeepTrace   │◄────►│ Elasticsearch│       │
│  │   Server     │      │   Database   │       │
│  └──────────────┘      └──────────────┘       │
│         ▲                                      │
│         │                                      │
│         ▼                                      │
│  ┌──────────────┐      ┌──────────────┐       │
│  │  DeepTrace   │◄────►│ Microservice │       │
│  │    Agent     │      │     Apps     │       │
│  └──────────────┘      └──────────────┘       │
│                                                 │
└─────────────────────────────────────────────────┘
Key Benefits
- Simple Setup: Single command deployment
- Quick Learning: Understand all components on one host
- Easy Testing: Perfect for evaluation and development
- Minimal Resources: Requires only one host
- Fast Iteration: Quick development and testing cycles
Configuration
In single host mode, the server and agent IPs must be identical:
[server]
ip = "192.168.1.100"              # Your host IP

[[agents]]
  [agents.agent_info]
  agent_name = "local-agent"
  host_ip = "192.168.1.100"       # Same as server.ip
  user_name = "ubuntu"
  ssh_port = 22
  host_password = "password"
💡 Important:
server.ipandagents.agent_info.host_ipmust be identical.
Quick Start
For complete single host deployment, follow the Quick Start Guide:
- Clone repository and configure settings
- Deploy server (DeepTrace + Elasticsearch)
- Deploy sample app (BookInfo or Social Network)
- Install agent (compiles and starts monitoring)
- Generate traffic and build traces
- View results in Kibana dashboard
Requirements
- OS: Ubuntu 24.04 LTS
- Memory: 8GB RAM minimum
- Storage: 40GB free space
- Docker: v26.1.3+
- Network: Internet connectivity
Use Cases
Choose single host mode when:
- Learning DeepTrace functionality
- Developing and testing applications
- Demonstrating tracing capabilities
- Working with small-scale systems
- Prototyping and proof-of-concept work
Limitations
- Limited to single host resources
- Not suitable for production at scale
- No high availability
- Cannot distribute load across multiple hosts
- Limited by single host performance
Comparison with Distributed Mode
| Aspect | Single Host | Distributed |
|---|---|---|
| Complexity | Simple, single host | Complex, multiple hosts |
| Use Case | Testing, development | Production, large scale |
| Resources | 8GB RAM, 40GB disk | Varies by scale |
| Scalability | Limited to one host | Highly scalable |
| Maintenance | Easy | Requires orchestration |
| Setup Time | 10 minutes | Hours to days |
Troubleshooting
Common Issues
- Port conflicts: Ensure ports 5601, 9200, and application ports are available
- Resource constraints: Monitor memory and disk usage
- Docker issues: Verify Docker is running and has sufficient resources
- Network connectivity: Check that services can communicate
Performance Optimization
# Monitor resource usage
sudo docker stats

# Check available disk space
df -h

# Monitor memory usage
free -h

# Check system load
top
Migration to Distributed
When ready to move to production, you can migrate to distributed mode:
- Export configuration: Save current settings
- Plan architecture: Design multi-host deployment
- Configure distributed setup: Update configuration files
- Deploy incrementally: Start with server, then add agents
- Validate functionality: Ensure all components work correctly
Next Steps
- Quick Start Guide: Complete deployment walkthrough
- Distributed Mode: Learn about production deployment
- Basic Usage: Explore DeepTrace operations
- Workload Applications: Deploy test applications
Workload Applications
DeepTrace includes test microservice applications for demonstrating distributed tracing capabilities. These applications generate realistic network traffic patterns that help you understand how DeepTrace collects and correlates traces.
Available Workloads
| Application | Complexity | Services | Use Case |
|---|---|---|---|
| BookInfo | Simple | 4 services | Learning, basic testing |
| Social Network | Complex | 15+ services | Advanced testing, performance evaluation |
BookInfo Application
Overview
BookInfo is a simple microservices application that displays information about books. It consists of four services:
- Product Page: Frontend service that displays book information
- Details Service: Provides book details (author, ISBN, etc.)
- Reviews Service: Manages book reviews
- Ratings Service: Provides book ratings
Quick Deployment
# Navigate to BookInfo directory
cd tests/workload/bookinfo

# Deploy all services
sudo bash deploy.sh
Generate Traffic
# Generate test traffic to create traces
sudo bash client.sh
The client script will:
- Send HTTP requests to the product page
- Trigger inter-service communication
- Generate network traffic for DeepTrace to capture
Cleanup
# Stop and remove all services
sudo bash clear.sh
Social Network Application
Overview
Social Network is a complex microservices application that implements a Twitter-like social media platform. It includes services for:
- User management and authentication
- Timeline and post management
- Media handling and storage
- Social graph and recommendations
- Notification systems
Quick Deployment
# Navigate to Social Network directory
cd tests/workload/socialnetwork

# Deploy the full application stack
bash deploy.sh
Generate Traffic
# Generate realistic social media traffic
bash client.sh
The client generates:
- User registration and login requests
- Post creation and timeline updates
- Social interactions (likes, follows)
- Media uploads and downloads
Cleanup
# Stop and remove all services
bash clear.sh
Integration with DeepTrace
Workflow with Workloads
- Deploy DeepTrace: Follow the Quick Start Guide
- Deploy workload: Choose BookInfo or Social Network
- Start agent: Begin collecting traces
- Generate traffic: Run client scripts to create network activity
- Process traces: Run correlation and assembly
- Analyze results: View traces in Kibana
Example Complete Workflow
# 1. Deploy workload application
cd tests/workload/bookinfo
sudo bash deploy.sh

# 2. Start DeepTrace agent
sudo docker exec -it deeptrace_server python -m cli.src.cmd agent run

# 3. Generate traffic
sudo bash client.sh

# 4. Process traces
sudo docker exec -it deeptrace_server python -m cli.src.cmd asso algo deeptrace
sudo docker exec -it deeptrace_server python -m cli.src.cmd assemble

# 5. View results in Kibana at http://YOUR_SERVER_IP:5601
Additional Resources
For detailed deployment instructions and architecture information:
- BookInfo: BookInfo README
- Social Network: Social Network README
- Basic Usage: Basic Usage Guide for trace collection and analysis
BookInfo Application
BookInfo is a simple microservices application that displays information about books. It's perfect for learning distributed tracing concepts and testing DeepTrace functionality.
Application Architecture
BookInfo consists of four microservices:
┌─────────────────┐    ┌─────────────────┐
│   Product Page  │◄──►│  Details Service│
│   (Frontend)    │    │                 │
└─────────┬───────┘    └─────────────────┘
          │
          ▼
┌─────────────────┐    ┌─────────────────┐
│ Reviews Service │◄──►│ Ratings Service │
│                 │    │                 │
└─────────────────┘    └─────────────────┘
Services Overview
| Service | Description | Technology | Port |
|---|---|---|---|
| Product Page | Frontend service that displays book information | Python | 9080 |
| Details Service | Provides book details (author, ISBN, etc.) | Ruby | 9080 |
| Reviews Service | Manages book reviews | Java | 9080 |
| Ratings Service | Provides book ratings | Node.js | 9080 |
Prerequisites
- Docker and Docker Compose installed
- DeepTrace server running
- Ports 9080 available
Quick Deployment
1. Deploy BookInfo Services
Navigate to the BookInfo directory and deploy all services:
cd tests/workload/bookinfo
sudo bash deploy.sh
The deployment script will:
- Install Docker and Docker Compose (if needed)
- Pull required Docker images
- Launch all services using Docker Compose
- Set up service networking
2. Verify Deployment
Check that all services are running:
sudo docker ps | grep bookinfo
You should see containers for:
bookinfo-productpagebookinfo-detailsbookinfo-reviewsbookinfo-ratings
3. Access the Application
Open your browser and visit:
http://localhost:9080/productpage
You should see the BookInfo product page displaying book information.
Generate Traffic for Tracing
Automated Traffic Generation
Use the provided client script to generate test traffic:
sudo bash client.sh
This script will:
- Start an interactive shell inside the client container
- Issue frontend requests against the BookInfo application
- Generate HTTP traffic between microservices
- Create network traces for DeepTrace to capture
Manual Traffic Generation
You can also generate traffic manually:
# Generate multiple requests
for i in {1..100}; do
  curl -s http://localhost:9080/productpage > /dev/null
  echo "Request $i completed"
  sleep 1
done
Traffic Patterns
The BookInfo application generates the following traffic patterns:
- Frontend Requests: User requests to product page
- Service-to-Service Calls:
- Product Page → Details Service
- Product Page → Reviews Service
- Reviews Service → Ratings Service
- Database Queries: Internal service data access
Integration with DeepTrace
Complete Workflow
-
Deploy BookInfo:
cd tests/workload/bookinfo sudo bash deploy.sh -
Start DeepTrace Agent:
sudo docker exec -it deeptrace_server python -m cli.src.cmd agent run -
Generate Traffic:
sudo bash client.sh -
Process Traces:
sudo docker exec -it deeptrace_server python -m cli.src.cmd asso algo deeptrace sudo docker exec -it deeptrace_server python -m cli.src.cmd assemble -
View Results: Access Kibana at
http://YOUR_SERVER_IP:5601
Expected Trace Data
When properly configured, you should see traces showing:
- HTTP requests between services
- Service response times
- Request flow through the microservice architecture
- Network connection details
Troubleshooting
Services Not Starting
# Check container logs
sudo docker logs bookinfo-productpage
sudo docker logs bookinfo-details
sudo docker logs bookinfo-reviews
sudo docker logs bookinfo-ratings

# Restart services
sudo docker-compose restart
No Network Traffic Captured
- Ensure DeepTrace agent is running
- Verify services are generating traffic
- Check that containers are on the same network
- Confirm eBPF programs are loaded
Port Conflicts
If port 9080 is already in use:
# Check what's using the port
sudo netstat -tulpn | grep 9080

# Stop conflicting services or modify docker-compose.yaml
Cleanup
Stop BookInfo Services
sudo bash clear.sh
This will:
- Stop all BookInfo containers
- Remove containers and networks
- Clean up Docker resources
Complete Cleanup
# Remove all BookInfo images
sudo docker rmi $(sudo docker images | grep bookinfo | awk '{print $3}')

# Remove unused networks
sudo docker network prune -f
Advanced Configuration
Custom Configuration
You can modify the docker-compose.yaml file to:
- Change service ports
- Add environment variables
- Configure resource limits
- Enable additional logging
Performance Testing
For performance testing with BookInfo:
# Install Apache Bench
sudo apt-get install apache2-utils

# Run load test
ab -n 1000 -c 10 http://localhost:9080/productpage
Next Steps
- Social Network Application: Try a more complex microservices application
- Trace Analysis: Learn how to analyze the collected traces
- Basic Usage: Explore advanced DeepTrace operations
Social Network Application
Social Network is a complex microservices application that implements a Twitter-like social media platform. It's ideal for testing DeepTrace with realistic, large-scale distributed systems.
Application Architecture
The Social Network application consists of 15+ microservices communicating via Thrift RPCs:
┌─────────────────┐    ┌─────────────────┐    ┌─────────────────┐
│   Nginx Web     │◄──►│  User Service   │◄──►│ User Timeline   │
│    Server       │    │                 │    │   Service       │
└─────────┬───────┘    └─────────────────┘    └─────────────────┘
          │
          ▼
┌─────────────────┐    ┌─────────────────┐    ┌─────────────────┐
│ Compose Post    │◄──►│ Post Storage    │◄──►│ Home Timeline   │
│   Service       │    │   Service       │    │   Service       │
└─────────────────┘    └─────────────────┘    └─────────────────┘
          │
          ▼
┌─────────────────┐    ┌─────────────────┐    ┌─────────────────┐
│ Social Graph    │◄──►│ URL Shortener   │◄──►│ Media Service   │
│   Service       │    │   Service       │    │                 │
└─────────────────┘    └─────────────────┘    └─────────────────┘
Core Services
| Service | Description | Technology | Port |
|---|---|---|---|
| Nginx Web Server | Frontend proxy and web interface | Nginx | 8080 |
| User Service | User management and authentication | C++ | 9090 |
| Compose Post Service | Post creation and processing | C++ | 9090 |
| Post Storage Service | Post data persistence | C++ | 9090 |
| User Timeline Service | Individual user timelines | C++ | 9090 |
| Home Timeline Service | Aggregated home timelines | C++ | 9090 |
| Social Graph Service | Follow relationships | C++ | 9090 |
| URL Shortener Service | URL shortening functionality | C++ | 9090 |
| Media Service | Image and video handling | C++ | 9090 |
| Text Service | Text processing and filtering | C++ | 9090 |
| Unique ID Service | Unique identifier generation | C++ | 9090 |
Supporting Infrastructure
| Component | Description | Port |
|---|---|---|
| MongoDB | Primary database | 27017 |
| Redis | Caching layer | 6379 |
| Memcached | Additional caching | 11211 |
| Jaeger | Distributed tracing (optional) | 16686 |
Prerequisites
- Docker and Docker Compose installed
- DeepTrace server running
- At least 8GB RAM available
- Ports 8080, 8081, 16686 available
- Python 3.5+ with asyncio and aiohttp
- Build dependencies: libssl-dev, libz-dev, luarocks, luasocket
Quick Deployment
1. Deploy Social Network Services
Navigate to the Social Network directory and deploy:
cd tests/workload/socialnetwork
sudo bash deploy.sh
The deployment script will:
- Install required dependencies
- Build Docker images
- Start all microservices
- Initialize databases
- Set up networking
2. Verify Deployment
Check that all services are running:
sudo docker ps | grep social
You should see containers for all microservices, databases, and supporting infrastructure.
3. Access the Application
Web Interface
Open your browser and visit:
http://localhost:8080
Media Frontend
Access the media interface at:
http://localhost:8081
Jaeger Tracing (if enabled)
View built-in traces at:
http://localhost:16686
Initialize Social Graph
Before generating traffic, initialize the social graph with users and relationships:
# Initialize with small Reed98 Facebook network
python3 scripts/init_social_graph.py --graph=socfb-Reed98

# Initialize with medium Ego Twitter network
python3 scripts/init_social_graph.py --graph=ego-twitter

# Initialize with large Twitter follows network
python3 scripts/init_social_graph.py --graph=soc-twitter-follows-mun
For remote deployments, specify IP and port:
python3 scripts/init_social_graph.py --graph=socfb-Reed98 --ip=YOUR_SERVER_IP --port=8080
Generate Traffic for Tracing
Automated Traffic Generation
Use the provided client script:
sudo bash client.sh
Manual Workload Generation
The Social Network application supports various workload patterns:
1. Compose Posts
../wrk2/wrk -D exp -t 12 -c 400 -d 300 -L \
  -s ./wrk2/scripts/social-network/compose-post.lua \
  http://localhost:8080/wrk2-api/post/compose -R 10
2. Read Home Timelines
../wrk2/wrk -D exp -t 12 -c 400 -d 300 -L \
  -s ./wrk2/scripts/social-network/read-home-timeline.lua \
  http://localhost:8080/wrk2-api/home-timeline/read -R 10
3. Read User Timelines
../wrk2/wrk -D exp -t 12 -c 400 -d 300 -L \
  -s ./wrk2/scripts/social-network/read-user-timeline.lua \
  http://localhost:8080/wrk2-api/user-timeline/read -R 10
Traffic Patterns
The Social Network application generates complex traffic patterns:
- User Authentication: Login/logout requests
- Post Operations: Create, read, update posts
- Timeline Operations: Home and user timeline requests
- Social Operations: Follow/unfollow, recommendations
- Media Operations: Image/video upload and retrieval
- Database Operations: MongoDB and Redis queries
- Cache Operations: Memcached read/write operations
Integration with DeepTrace
Complete Workflow
-
Deploy Social Network:
cd tests/workload/socialnetwork sudo bash deploy.sh -
Initialize Social Graph:
python3 scripts/init_social_graph.py --graph=socfb-Reed98 -
Start DeepTrace Agent:
sudo docker exec -it deeptrace_server python -m cli.src.cmd agent run -
Generate Traffic:
sudo bash client.sh -
Process Traces:
sudo docker exec -it deeptrace_server python -m cli.src.cmd asso algo deeptrace sudo docker exec -it deeptrace_server python -m cli.src.cmd assemble -
View Results: Access Kibana at
http://YOUR_SERVER_IP:5601
Expected Trace Data
With Social Network, you should see rich trace data including:
- Complex service-to-service communication patterns
- Database query traces (MongoDB, Redis, Memcached)
- HTTP and Thrift RPC calls
- Media upload/download operations
- Authentication and authorization flows
- Caching layer interactions
Advanced Features
Enable TLS
For TLS-enabled deployment:
sudo docker-compose -f docker-compose-tls.yml up -d
Enable Redis Sharding
For cache and database sharding:
sudo docker-compose -f docker-compose-sharding.yml up -d
Docker Swarm Deployment
For multi-node deployment:
docker stack deploy --compose-file=docker-compose-swarm.yml social-network
Performance Testing
Load Testing with wrk2
First, build the workload generator:
cd ../wrk2
make
cd ../socialNetwork
Then run various load tests:
# High-throughput compose posts
../wrk2/wrk -D exp -t 20 -c 800 -d 600 -L \
  -s ./wrk2/scripts/social-network/compose-post.lua \
  http://localhost:8080/wrk2-api/post/compose -R 100

# Mixed workload
../wrk2/wrk -D exp -t 16 -c 600 -d 300 -L \
  -s ./wrk2/scripts/social-network/mixed-workload.lua \
  http://localhost:8080 -R 50
Troubleshooting
Services Not Starting
# Check individual service logs
sudo docker logs social-network-nginx-thrift
sudo docker logs social-network-user-service
sudo docker logs social-network-compose-post-service

# Check database connectivity
sudo docker logs social-network-mongodb
sudo docker logs social-network-redis
Database Connection Issues
# Restart databases
sudo docker restart social-network-mongodb social-network-redis

# Check database status
sudo docker exec social-network-mongodb mongo --eval "db.stats()"
sudo docker exec social-network-redis redis-cli ping
Memory Issues
The Social Network application is resource-intensive:
# Monitor resource usage
sudo docker stats

# Increase Docker memory limits if needed
# Edit docker-compose.yml and add memory limits
No Network Traffic Captured
- Ensure all services are fully started (can take 2-3 minutes)
- Verify social graph initialization completed
- Check that DeepTrace agent is monitoring the correct containers
- Confirm eBPF programs are loaded for all relevant processes
Cleanup
Stop Social Network Services
sudo bash clear.sh
Complete Cleanup
# Remove all Social Network images
sudo docker rmi $(sudo docker images | grep social | awk '{print $3}')

# Clean up volumes
sudo docker volume prune -f

# Remove networks
sudo docker network prune -f
Monitoring and Observability
Built-in Jaeger Tracing
The Social Network application includes Jaeger tracing:
# Access Jaeger UI
http://localhost:16686
Custom Metrics
Monitor application metrics:
# Service health endpoints
curl http://localhost:8080/health
curl http://localhost:8081/health

# Database metrics
sudo docker exec social-network-mongodb mongo --eval "db.serverStatus()"
sudo docker exec social-network-redis redis-cli info
Development and Customization
Modifying Services
The Social Network application is actively developed. You can:
- Modify service configurations in
config/ - Customize workload scripts in
wrk2/scripts/ - Adjust Docker Compose configurations
- Add custom monitoring and logging
Building from Source
# Build custom images
sudo docker-compose build

# Build specific services
sudo docker-compose build user-service
sudo docker-compose build compose-post-service
Next Steps
- BookInfo Application: Try a simpler microservices application
- Trace Analysis: Learn advanced trace analysis techniques
- Basic Usage: Explore DeepTrace operations
- Database Management: Configure advanced Elasticsearch setups
Trace Analysis
This section covers advanced trace analysis techniques and tools for understanding distributed system behavior through DeepTrace data.
Overview
Trace analysis helps you:
- Identify performance bottlenecks in distributed systems
- Understand service dependencies and communication patterns
- Debug complex issues across multiple services
- Monitor system health and reliability
Analysis Tools
Kibana Dashboard
Access the primary analysis interface through Kibana:
URL: http://YOUR_SERVER_IP:5601
Username: elastic
Password: YOUR_ELASTIC_PASSWORD
Key Analysis Features
| Feature | Description | Use Case |
|---|---|---|
| Discover | Search and filter traces | Find specific requests or errors |
| Visualize | Create charts and graphs | Monitor trends and patterns |
| Dashboard | Combine multiple visualizations | System overview and monitoring |
Trace Data Structure
Span Information
Each span contains:
- Trace ID: Links spans belonging to the same request
- Span ID: Unique identifier for each span
- Parent ID: Creates the trace hierarchy
- Service Name: Identifies the source service
- Operation: Specific function or endpoint
- Duration: Time taken for the operation
- Tags: Additional metadata and labels
Correlation Data
DeepTrace provides correlation information:
- Network connections: TCP/UDP connection details
- Process information: PID, container ID, host details
- Timing data: Precise timestamps and latencies
- Protocol data: HTTP, database, and other protocol specifics
Analysis Techniques
Performance Analysis
Identify slow requests:
- Sort traces by duration
- Examine longest-running spans
- Analyze service-to-service latencies
- Look for patterns in slow operations
Example Kibana query:
duration:>1000 AND service.name:"product-page"
Error Analysis
Find failed requests:
- Filter by error status codes
- Examine error messages and stack traces
- Correlate errors across services
- Identify error propagation patterns
Example Kibana query:
tags.http.status_code:>=400 OR tags.error:true
Dependency Analysis
Understand service relationships:
- Map service-to-service communications
- Identify critical path dependencies
- Analyze communication patterns
- Detect circular dependencies
Traffic Pattern Analysis
Monitor system behavior:
- Analyze request volume over time
- Identify peak usage periods
- Monitor service load distribution
- Detect unusual traffic patterns
Common Analysis Scenarios
Debugging Slow Requests
-
Find the slow trace:
- Sort by duration in Kibana
- Identify traces exceeding SLA thresholds
-
Analyze the trace structure:
- Examine span hierarchy
- Identify the slowest spans
- Check for blocking operations
-
Investigate root causes:
- Database query performance
- Network latency issues
- Resource contention
- External service delays
Service Health Monitoring
-
Error rate monitoring:
- Track error percentages by service
- Set up alerts for threshold breaches
- Monitor error trends over time
-
Latency monitoring:
- Track response time percentiles
- Monitor SLA compliance
- Identify performance degradation
-
Throughput analysis:
- Monitor request volume
- Analyze capacity utilization
- Plan for scaling needs
Capacity Planning
-
Resource utilization:
- Analyze service load patterns
- Identify bottleneck services
- Monitor growth trends
-
Scaling decisions:
- Determine which services need scaling
- Understand traffic distribution
- Plan infrastructure changes
Best Practices
Effective Querying
- Use specific time ranges to improve query performance
- Combine multiple filters for precise results
- Save useful queries for repeated analysis
- Use wildcards carefully to avoid performance issues
Dashboard Creation
- Group related metrics on the same dashboard
- Use appropriate visualization types for different data
- Set up refresh intervals for real-time monitoring
- Share dashboards with team members
Alert Configuration
- Set meaningful thresholds based on SLA requirements
- Avoid alert fatigue with appropriate sensitivity
- Include context in alert messages
- Test alert conditions before deployment
Advanced Analysis
Custom Visualizations
Create specialized charts for:
- Service dependency graphs
- Request flow diagrams
- Performance heat maps
- Error correlation matrices
Data Export
Export trace data for:
- External analysis tools
- Long-term storage
- Compliance reporting
- Machine learning analysis
Integration with Other Tools
Connect DeepTrace data with:
- APM tools for enhanced monitoring
- Log aggregation systems
- Metrics collection platforms
- Incident management systems
Next Steps
- Web UI: Explore the web-based monitoring interface
- Database Setup: Advanced Elasticsearch configuration
- Basic Usage: Learn essential DeepTrace operations
Web Interface
The DeepTrace web interface provides an intuitive user experience, enabling users to interact with the system effortlessly. Through the collaboration of the frontend, backend, and database, the system efficiently processes data and delivers real-time feedback.
UI Architecture
graph TD
    UI_Frontend -->|Calls API| UI_Backend
    UI_Backend -->|Fetches data| ElasticDB[Elastic Database]
    UI_Frontend -->|Displays data| User[End User]
Component Descriptions
-
UI Frontend
TheUI_Frontendis the user-facing component of the system. It is responsible for rendering the interface and interacting with the user. The frontend communicates with the backend via APIs to fetch and display data.- Code Repository: DeepTrace Frontend Repository
-
UI Backend
TheUI_Backendacts as the intermediary between the frontend and the database. It provides APIs for the frontend to call and handles data processing, business logic, and communication with the database.- Code Repository: DeepTrace Backend Repository
-
Elastic Database
TheElasticDBis the data storage component of the system. It stores all the necessary data and allows the backend to query and retrieve information as needed. It is optimized for search and analytics, making it suitable for handling large datasets efficiently.
Deployment Instructions
Backend
To deploy the backend, follow these steps:
-
Clone the Repository
Clone the backend code repository using the following command:git clone https://github.com/DeepShield-AI/DeepTrace-server.git cd DeepTrace-server -
Modify Configuration File
Update the following properties in the configuration file located at application.properties:spring.elasticsearch.uris=http://xxx spring.elasticsearch.username=xxx spring.elasticsearch.password=xxx -
Build the Project
Run the following commands to build the backend:chmod +x mvnw sudo docker run --privileged --rm -it -v $(pwd):/app docker.1ms.run/maven:3.9.6-eclipse-temurin-17 bash -c "cd /app; ./mvnw clean package" -
Run the Application
Start the backend application using the following command:java -jar ./start/target/start-0.0.1-SNAPSHOT.jar
Frontend
To deploy the frontend, follow these steps:
-
Clone the Repository
Clone the frontend code repository using the following command:git clone https://gitee.com/qcl_CSTP/deeptrace-platform-side.git cd deeptrace-platform-side -
Modify Configuration File
Update the necessary configuration settings. TODO: Add specific configuration details here. -
Install Dependencies
Ensure that Node.js and npm are installed. If not, install them using the following commands:sudo apt update sudo apt install -y nodejs npmThen, install the project dependencies:
npm install -
Run the Application
Start the frontend application using the following command:npm start
UI Functionality Description
Trace Chain Tracking Module
Real-time tracking of service call chains, presenting data such as request count, error count, and response latency through charts. Supports filtering by response status, endpoint, and application protocol. Users can view detailed information about specific call chains (e.g., topology, latency, number of spans), aiding in identifying issues in service calls.
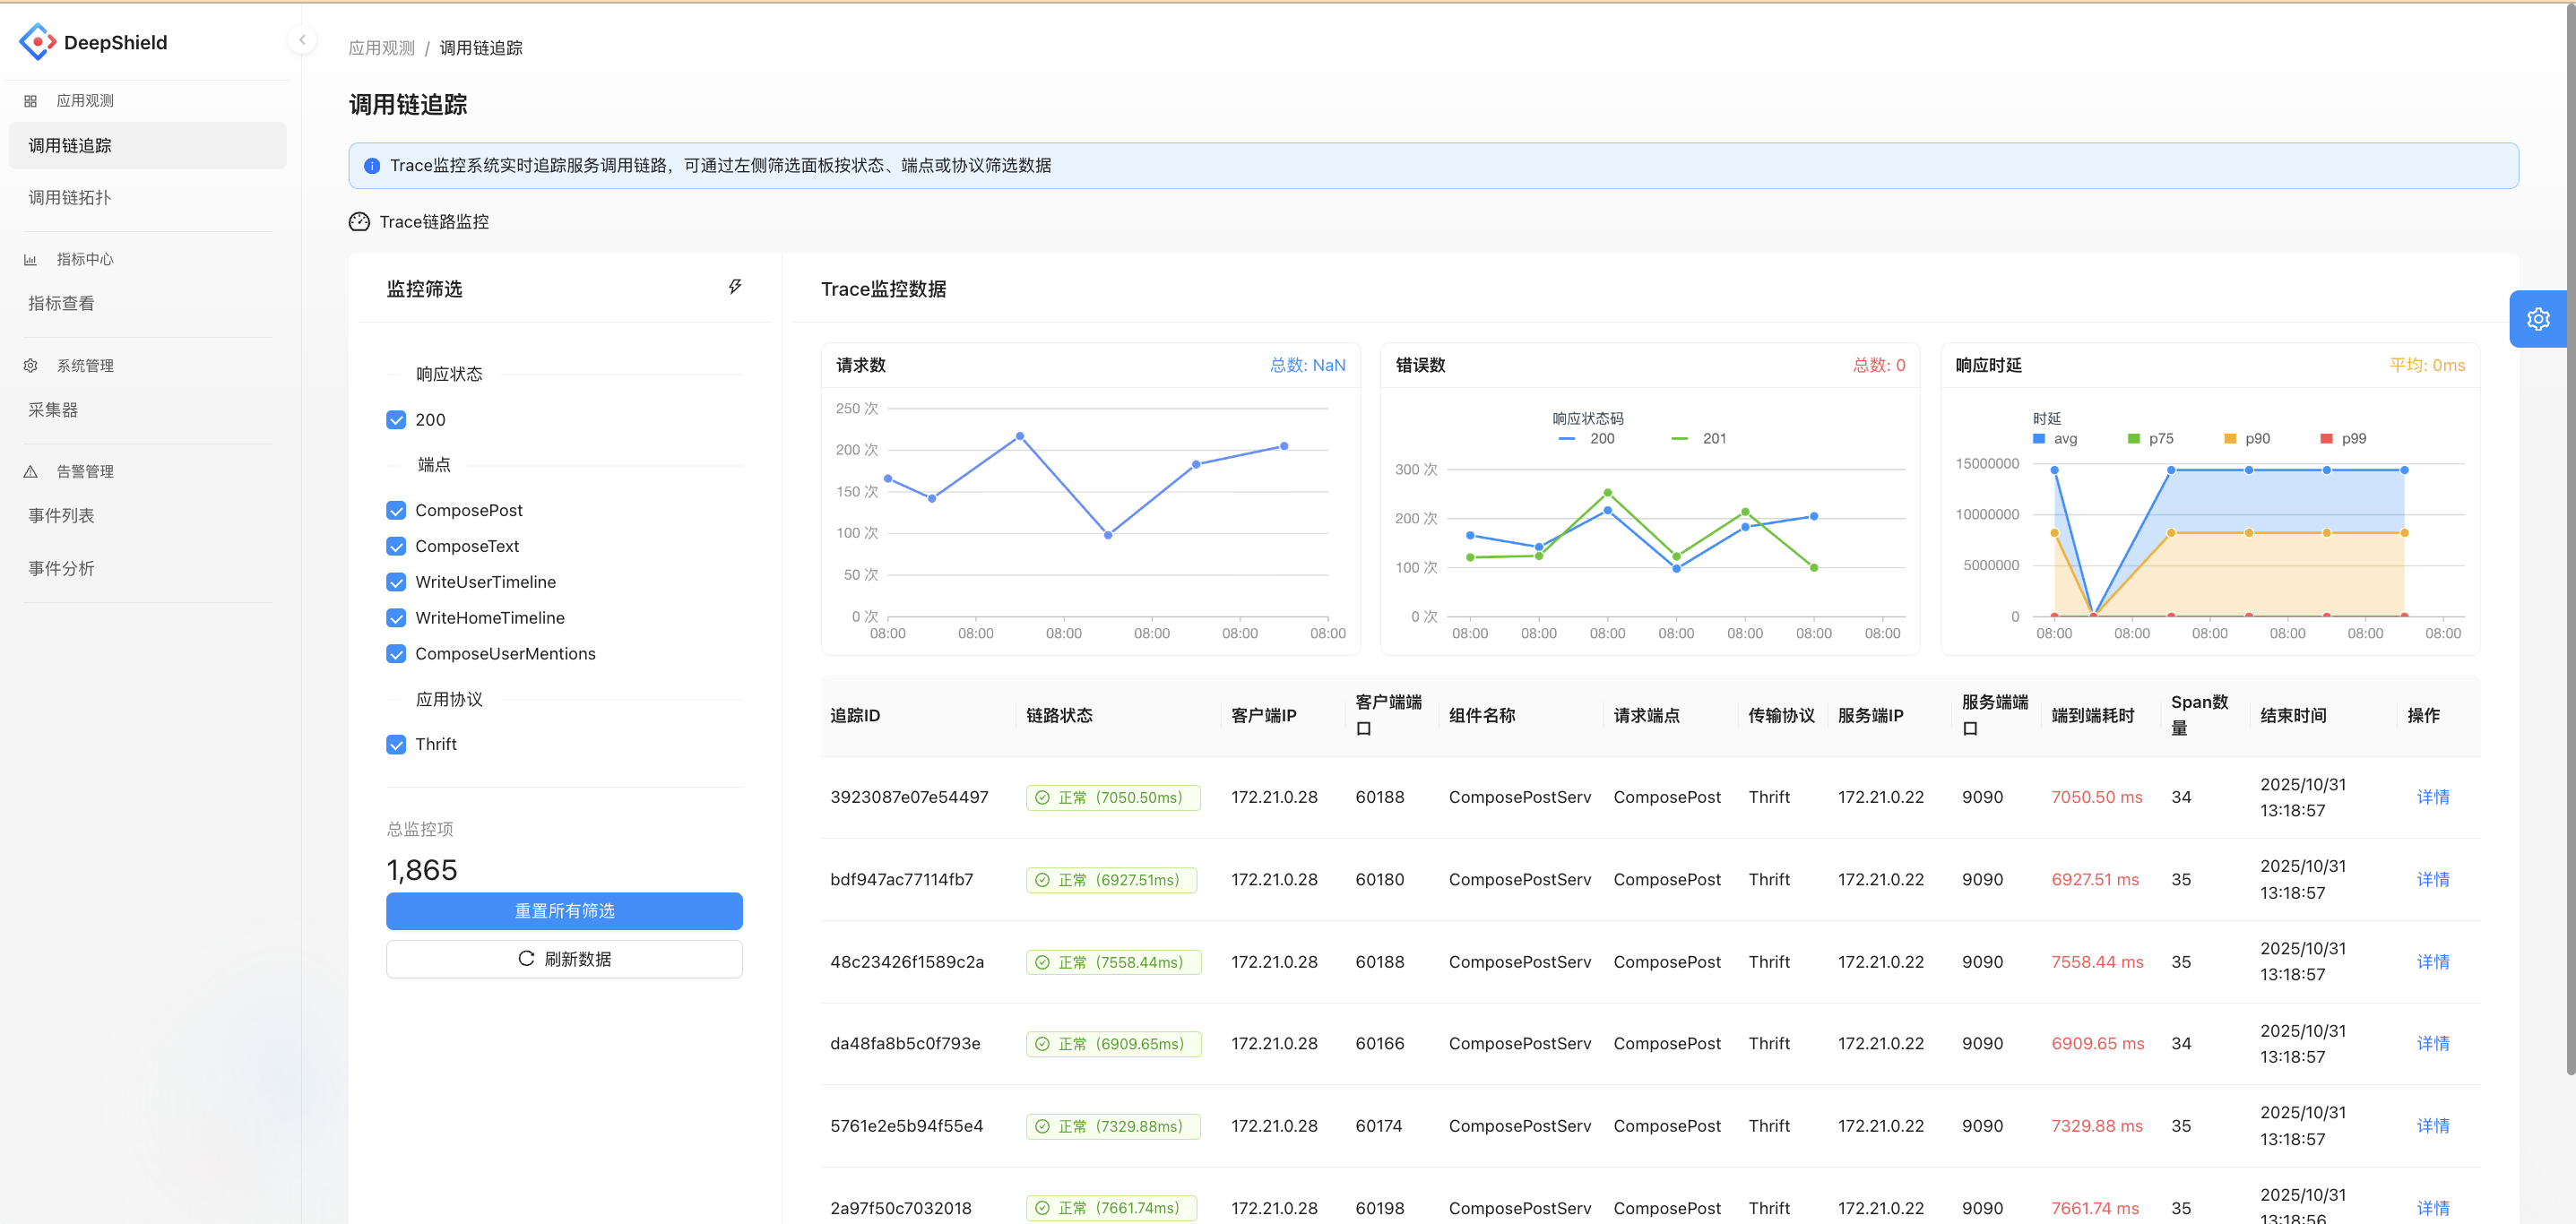
Trace Chain Topology Module
Displays the relationships between service nodes in the form of a topology graph, showing metrics such as QPS, average latency, and error rate for each service. This helps analyze the health and dependencies of service calls, making it easier to identify abnormal service nodes.
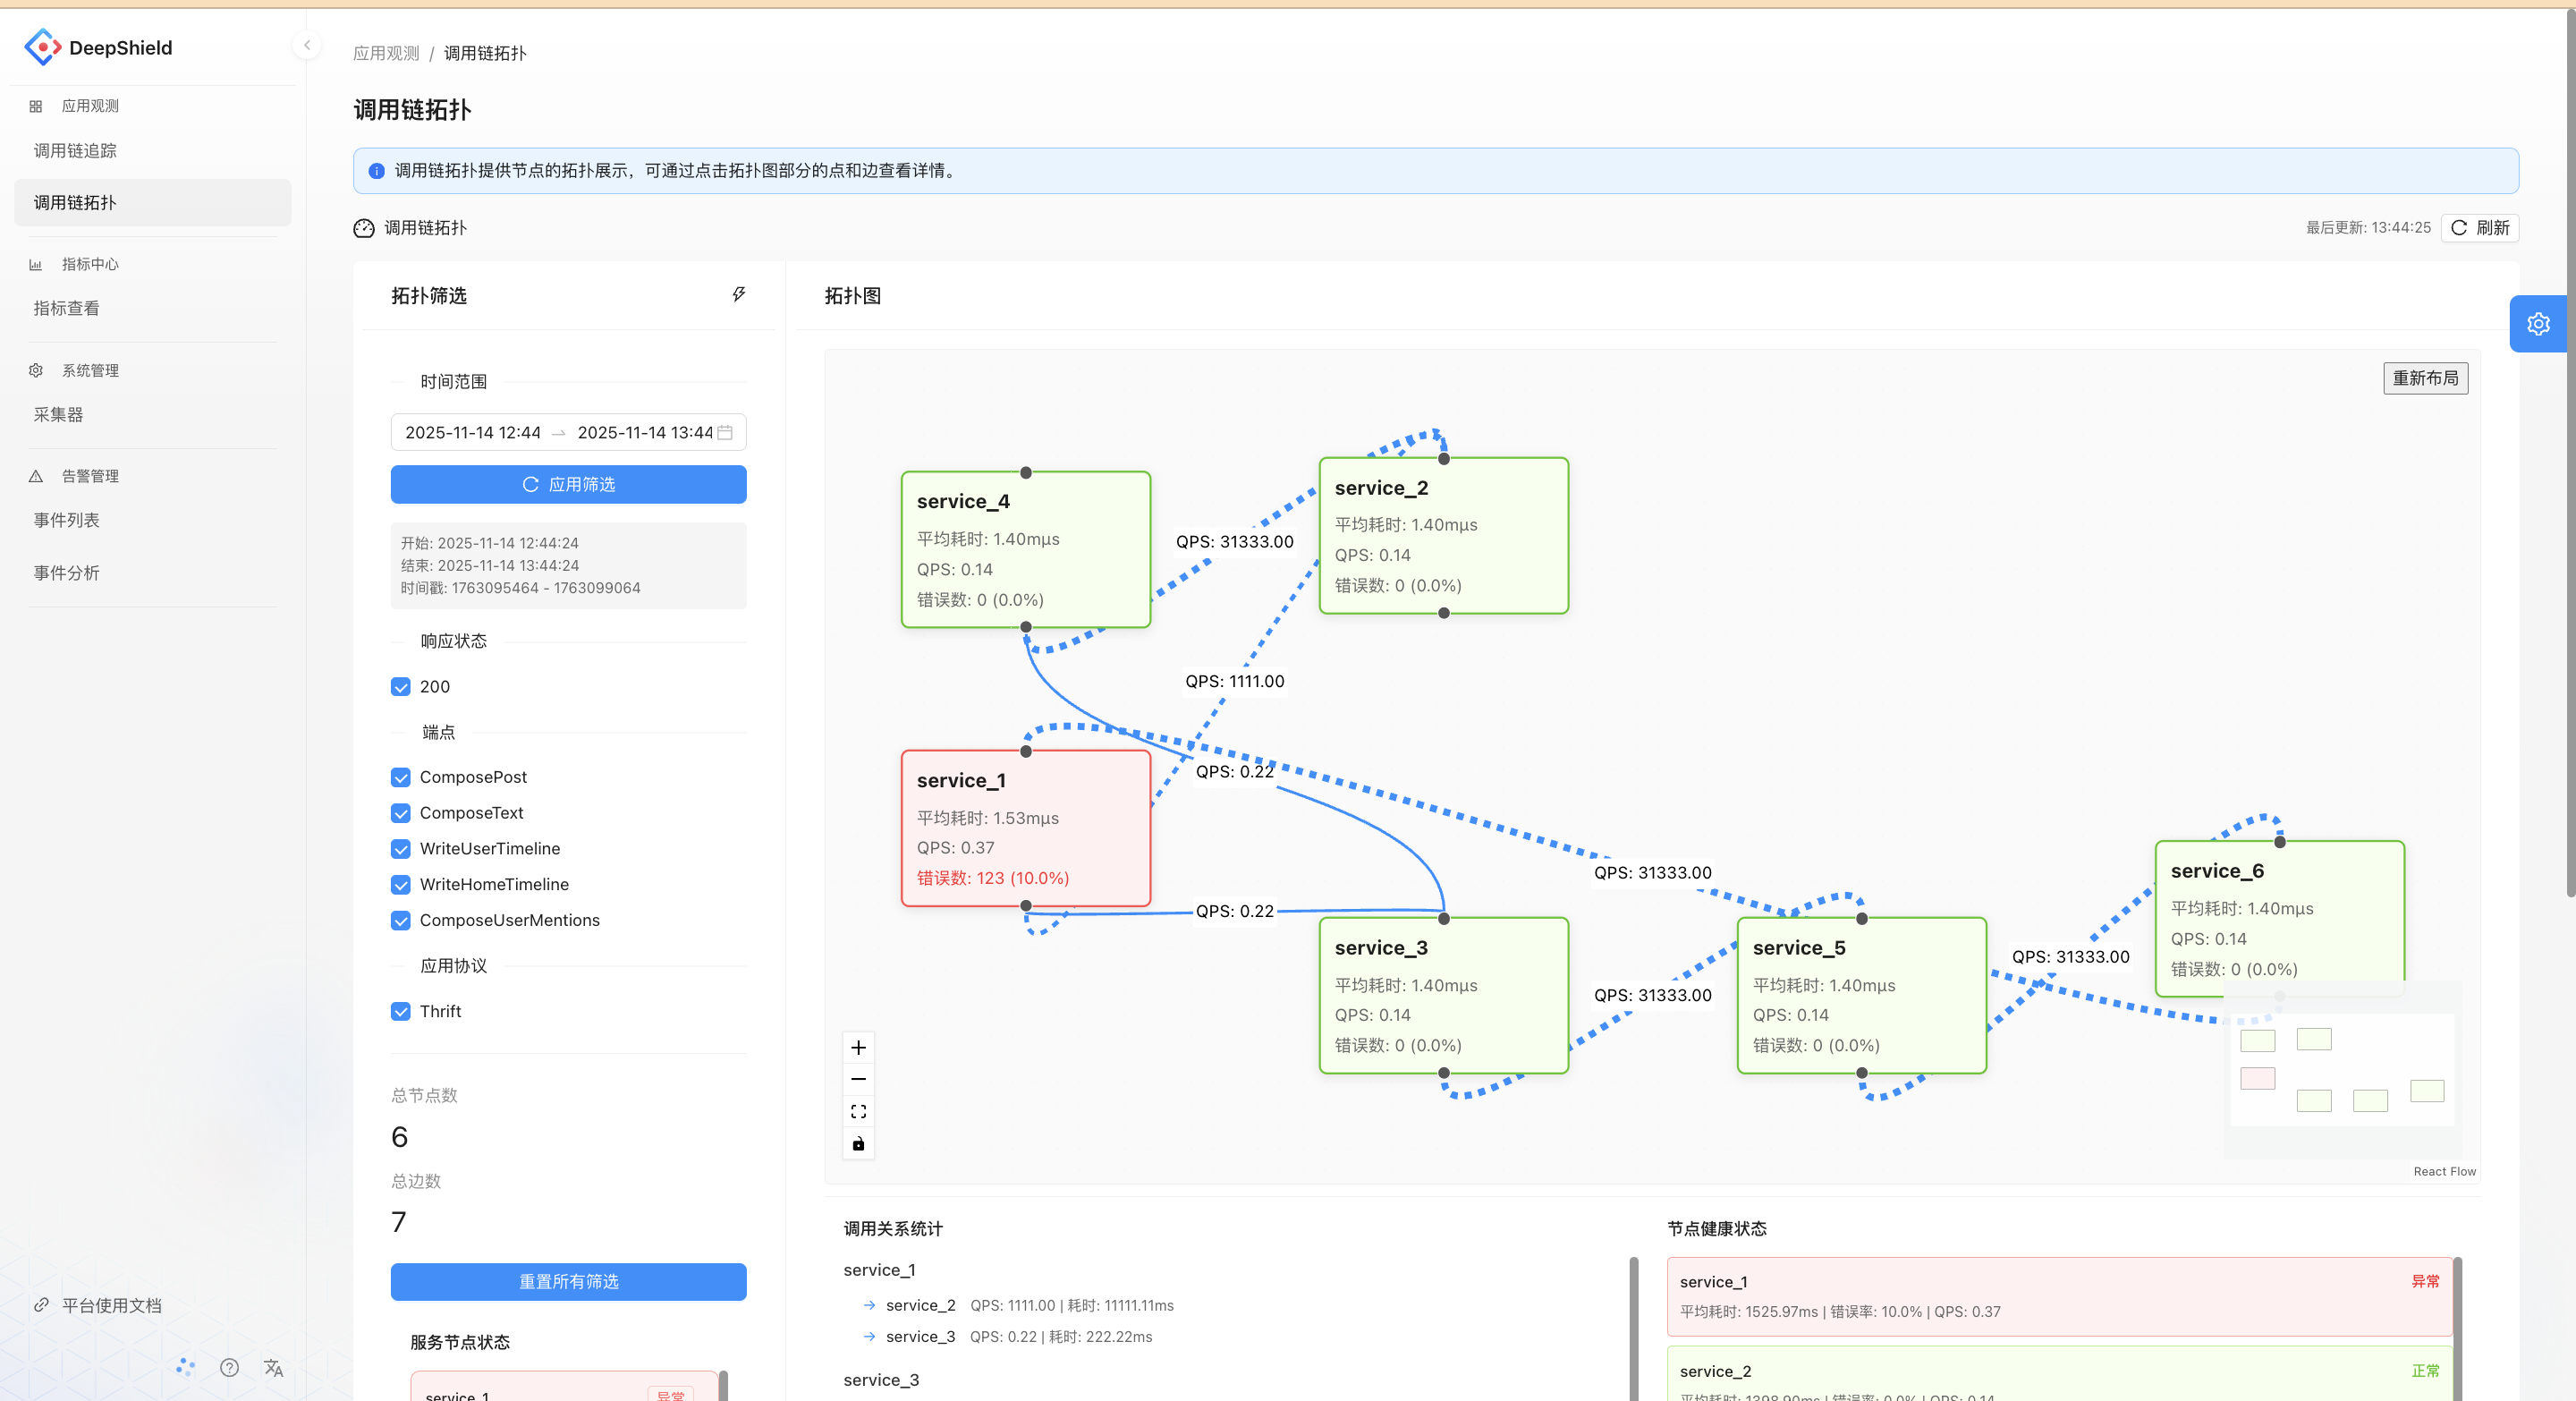
Collector Management Module
Manages the list and basic information of collectors (e.g., CPU cores, running status, system version). Supports operations such as registration, enabling, and disabling. This module provides data collection support for monitoring functions like call chain tracking and metric collection.
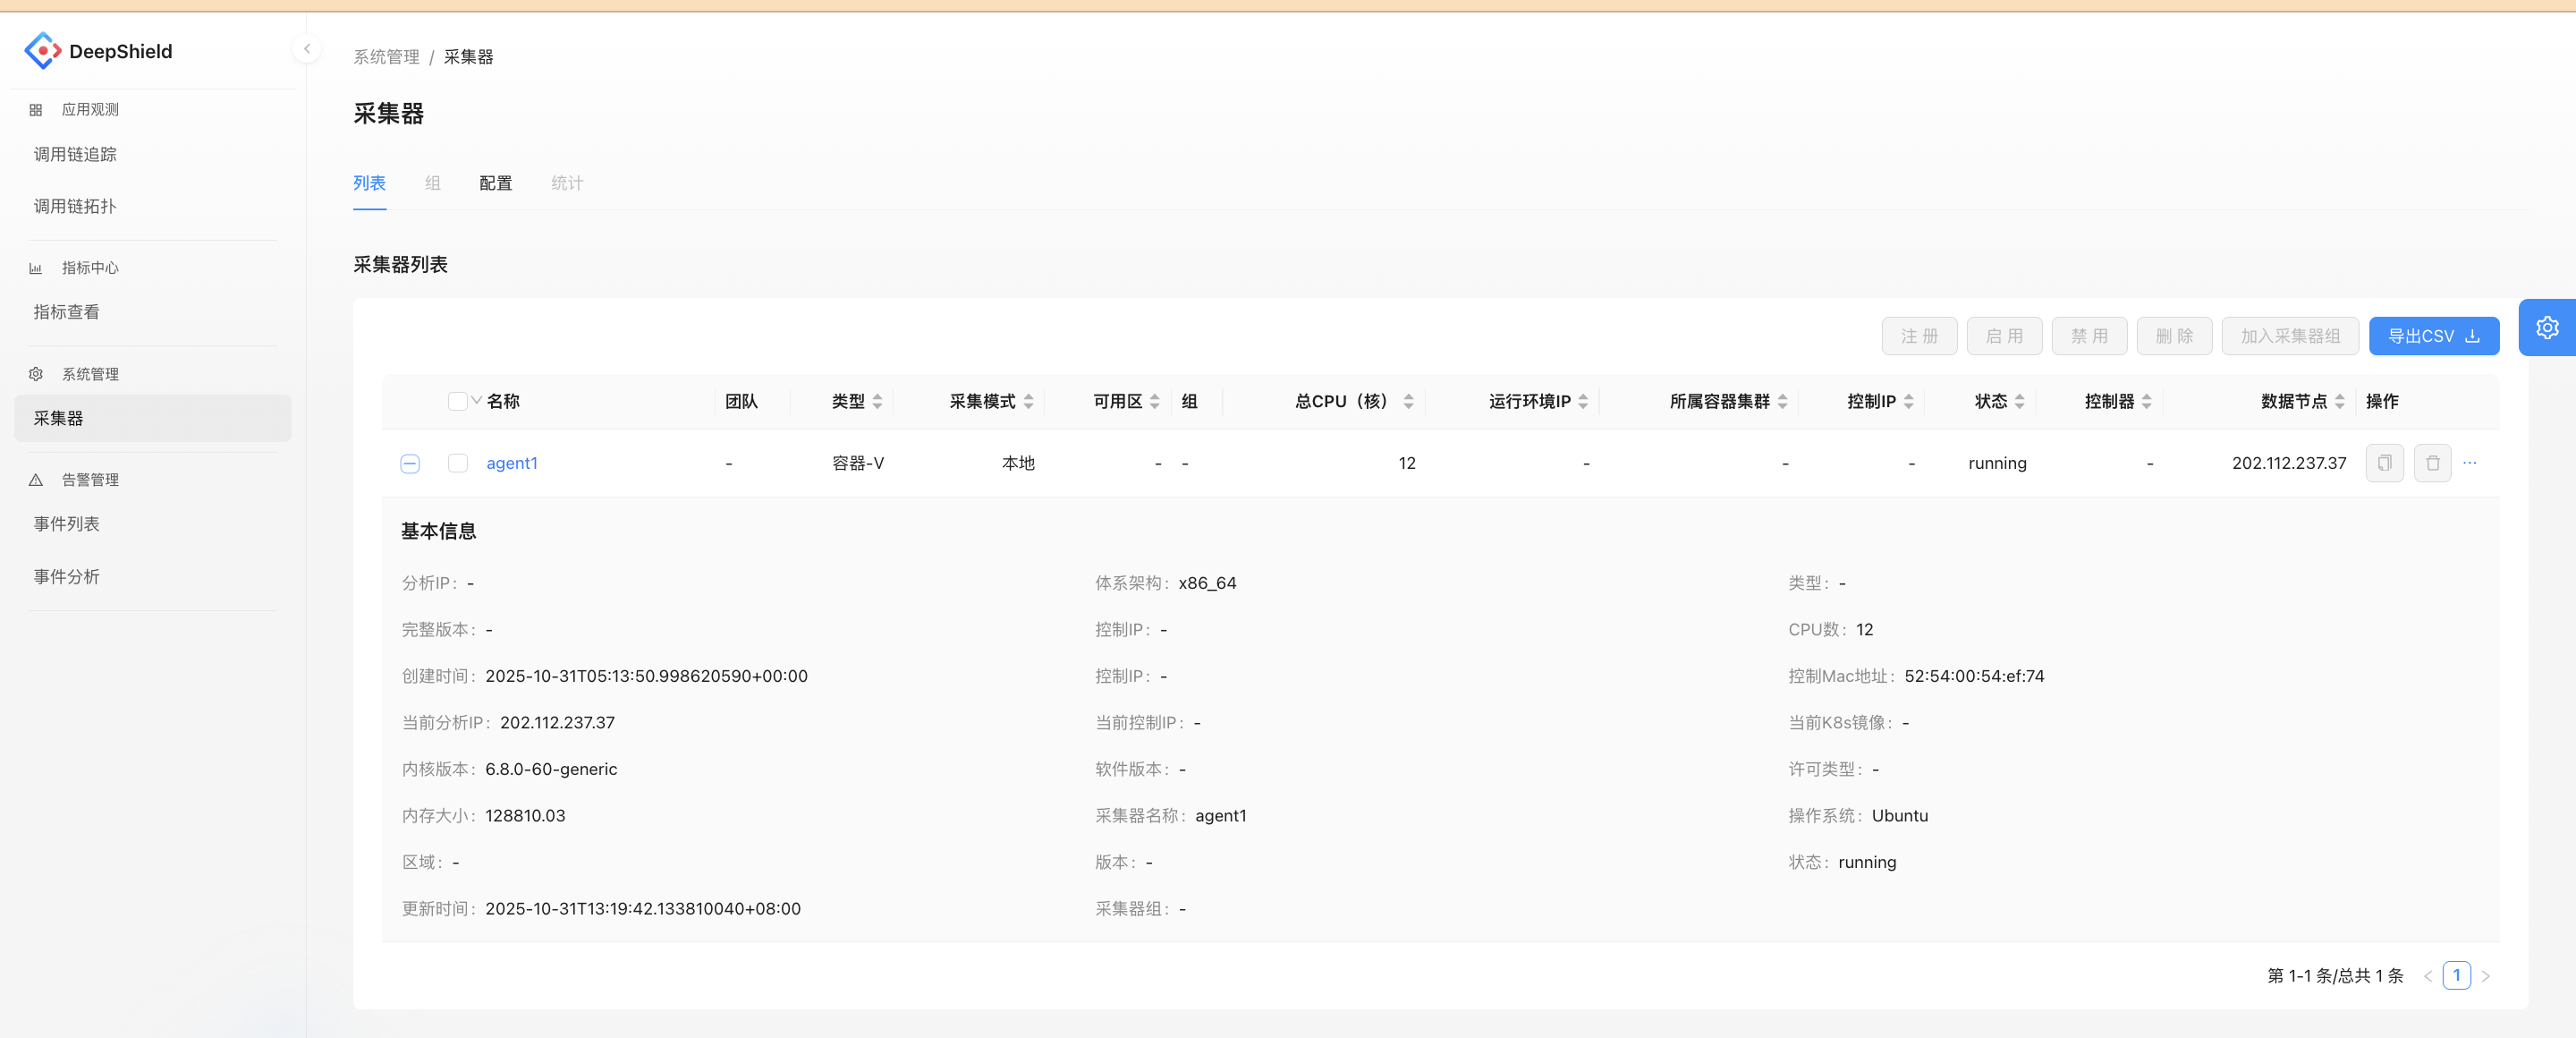
Database
This document aims to guide users through the installation and testing of a multi-node Docker-based Elasticsearch database cluster. It provides detailed steps for setting up the cluster and verifying its functionality.
Elastic Multi-Node Docker Installation Guide
Core Conclusion
This guide demonstrates the deployment of a multi-node Elasticsearch cluster (including Kibana) using Docker. By splitting configuration files, synchronizing certificates, and setting environment variables, cross-node deployment is achieved, resulting in a healthy and functional cluster environment.
1. Environment Preparation
-
Basic Requirements:
- Docker: 24.0.7+
- Docker Compose: v2.21.0+
- Operating System: Linux/amd64
-
Image Details:
- Elasticsearch: 8.15.2
- Kibana: 8.15.2
-
Node Planning:
At least two nodes are required. In this example, we use two nodes:- Node 1: IP address
ip1, hosting Elasticsearch instancees01and Kibana. - Node 2: IP address
ip2, hosting Elasticsearch instancees02.
- Node 1: IP address
2. Pre-Deployment Preparation
1. Directory and Permission Configuration (All Nodes)
- Create Mount Directories by Node Role:
- Node 1: Create
/opt/data/{es01,kibana} - Node 2: Create
/opt/data/es02
- Node 1: Create
- Set Directory Permissions:
Execute the following command to set permissions, ensuring compatibility with the non-root user (ID 1000) inside the container:chown -R 1000:1000 /opt/data/<directory>
2. Configuration File Preparation (Node 1 First)
-
Create
.envFile:
Define core parameters such as Elastic and Kibana passwords, cluster name, version, ports, and memory limits. Below is an example:# Password for the 'elastic' user (at least 6 characters) ELASTIC_PASSWORD=1qazXSW@ # Password for the 'kibana_system' user (at least 6 characters) KIBANA_PASSWORD=1qazXSW@ # Version of Elastic products STACK_VERSION=8.15.2 # Set the cluster name CLUSTER_NAME=es-cluster # Set to 'basic' or 'trial' to automatically start the 30-day trial LICENSE=basic #LICENSE=trial # Port to expose Elasticsearch HTTP API to the host ES_PORT=9200 #ES_PORT=127.0.0.1:9200 # Port to expose Kibana to the host KIBANA_PORT=5601 #KIBANA_PORT=80 # Increase or decrease based on the available host memory (in bytes) MEM_LIMIT=17179869184 # Project namespace (defaults to the current folder name if not set) #COMPOSE_PROJECT_NAME=myproject -
Create
docker-compose.yamlFile:
Include the following services:setup: For certificate generation.es01: Elasticsearch instance.kibana: Kibana instance.
Configure mount directories, environment variables, and network modes as needed. Below is an example:
version: "3"

services:
  setup:
    image: docker.elastic.co/elasticsearch/elasticsearch:${STACK_VERSION}
    volumes:
      - ./certs:/usr/share/elasticsearch/config/certs
    user: "0"
    command: >
      bash -c '
        if [ x${ELASTIC_PASSWORD} == x ]; then
          echo "Set the ELASTIC_PASSWORD environment variable in the .env file";
          exit 1;
        elif [ x${KIBANA_PASSWORD} == x ]; then
          echo "Set the KIBANA_PASSWORD environment variable in the .env file";
          exit 1;
        fi;
        if [ ! -f config/certs/ca.zip ]; then
          echo "Creating CA";
          bin/elasticsearch-certutil ca --silent --pem -out config/certs/ca.zip;
          unzip config/certs/ca.zip -d config/certs;
        fi;
        if [ ! -f config/certs/certs.zip ]; then
          echo "Creating certs";
          echo -ne \
          "instances:\n"\
          "  - name: es01\n"\
          "    dns:\n"\
          "      - es01\n"\
          "    ip:\n"\
          "      - ip1\n"\
          "  - name: es02\n"\
          "    dns:\n"\
          "      - es02\n"\
          "    ip:\n"\
          "      - ip2\n"\
          > config/certs/instances.yml;
          bin/elasticsearch-certutil cert --silent --pem -out config/certs/certs.zip --in config/certs/instances.yml --ca-cert config/certs/ca/ca.crt --ca-key config/certs/ca/ca.key;
          unzip config/certs/certs.zip -d config/certs;
        fi;
        echo "Setting file permissions"
        chown -R root:root config/certs;
        find . -type d -exec chmod 750 \{\} \;;
        find . -type f -exec chmod 640 \{\} \;;
        echo "Waiting for Elasticsearch availability";
        until curl -s --cacert config/certs/ca/ca.crt https://ip1:9200 | grep -q "missing authentication credentials"; do sleep 30; done;
        echo "Setting kibana_system password";
        until curl -s -X POST --cacert config/certs/ca/ca.crt -u "elastic:${ELASTIC_PASSWORD}" -H "Content-Type: application/json" https://ip1:9200/_security/user/kibana_system/_password -d "{\"password\":\"${KIBANA_PASSWORD}\"}" | grep -q "^{}"; do sleep 10; done;
        echo "All done!";
      '
    healthcheck:
      test: ["CMD-SHELL", "[ -f config/certs/es01/es01.crt ]"]
      interval: 1s
      timeout: 5s
      retries: 120

  es01:
    depends_on:
      setup:
        condition: service_healthy
    image: docker.elastic.co/elasticsearch/elasticsearch:${STACK_VERSION}
    volumes:
      - ./certs:/usr/share/elasticsearch/config/certs
      - /opt/data/es01:/usr/share/elasticsearch/data
    environment:
      - node.name=es01
      - cluster.name=${CLUSTER_NAME}
      - cluster.initial_master_nodes=es01,es02
      - discovery.seed_hosts=ip2
      - ELASTIC_PASSWORD=${ELASTIC_PASSWORD}
      - bootstrap.memory_lock=true
      - xpack.security.enabled=true
      - xpack.security.http.ssl.enabled=true
      - xpack.security.http.ssl.key=certs/es01/es01.key
      - xpack.security.http.ssl.certificate=certs/es01/es01.crt
      - xpack.security.http.ssl.certificate_authorities=certs/ca/ca.crt
      - xpack.security.transport.ssl.enabled=true
      - xpack.security.transport.ssl.key=certs/es01/es01.key
      - xpack.security.transport.ssl.certificate=certs/es01/es01.crt
      - xpack.security.transport.ssl.certificate_authorities=certs/ca/ca.crt
      - xpack.security.transport.ssl.verification_mode=certificate
      - xpack.license.self_generated.type=${LICENSE}
    restart: always
    network_mode: host
    ulimits:
      memlock:
        soft: -1
        hard: -1
    healthcheck:
      test:
        [
          "CMD-SHELL",
          "curl -s -k --cacert config/certs/ca/ca.crt https://localhost:9200 | grep -q 'missing authentication credentials'",
        ]
      interval: 10s
      timeout: 10s
      retries: 120

  kibana:
    depends_on:
      es01:
        condition: service_healthy
    image: docker.elastic.co/kibana/kibana:${STACK_VERSION}
    volumes:
      - ./certs:/usr/share/kibana/config/certs
      - /opt/data/kibana:/usr/share/kibana/data
    environment:
      - SERVERNAME=kibana
      - ELASTICSEARCH_HOSTS=https://ip1:9200
      - ELASTICSEARCH_USERNAME=kibana_system
      - ELASTICSEARCH_PASSWORD=${KIBANA_PASSWORD}
      - ELASTICSEARCH_SSL_CERTIFICATEAUTHORITIES=config/certs/ca/ca.crt
    restart: always
    network_mode: host
    healthcheck:
      test:
        [
          "CMD-SHELL",
          "curl -k -s -I http://localhost:5601 | grep -q 'HTTP/1.1 302 Found'",
        ]
      interval: 10s
      timeout: 10s
      retries: 120
3. Cluster Deployment Steps
1. Start es01 Node and Kibana
- Navigate to the configuration directory on the
es01node and start the services:docker compose up -d - Wait for the health checks to pass. You can verify the status using:
Ensure the status showsdocker compose psHealthyorStarted.
2. Synchronize Configuration Files to Other Nodes
- On the
es01node, execute the following command to synchronize the certificate directory and.envfile to the target node:scp -r certs/ .env target-node:/opt/compose/es/
3. Deploy es02 Node
- On the
es02node, create a dedicateddocker-compose.yamlfile. Retain only the configuration for the correspondingesservice, adapting parameters such as node name and discovery nodes. Below is an example:version: '3' services: es02: image: docker.elastic.co/elasticsearch/elasticsearch:${STACK_VERSION} volumes: - ./certs:/usr/share/elasticsearch/config/certs - /opt/data/es02/:/usr/share/elasticsearch/data environment: - node.name=es02 - cluster.name=${CLUSTER_NAME} - cluster.initial_master_nodes=es01,es02 - discovery.seed_hosts=ip1 - bootstrap.memory_lock=true - xpack.security.enabled=true - xpack.security.http.ssl.enabled=true - xpack.security.http.ssl.key=certs/es02/es02.key - xpack.security.http.ssl.certificate=certs/es02/es02.crt - xpack.security.http.ssl.certificate_authorities=certs/ca/ca.crt - xpack.security.transport.ssl.enabled=true - xpack.security.transport.ssl.key=certs/es02/es02.key - xpack.security.transport.ssl.certificate=certs/es02/es02.crt - xpack.security.transport.ssl.certificate_authorities=certs/ca/ca.crt - xpack.security.transport.ssl.verification_mode=certificate - xpack.license.self_generated.type=${LICENSE} restart: always network_mode: host ulimits: memlock: soft: -1 hard: -1 healthcheck: test: [ "CMD-SHELL", "curl -s -k --cacert config/certs/ca/ca.crt https://localhost:9200 | grep -q 'missing authentication credentials'", ] interval: 10s timeout: 10s retries: 120 - Start the service on the
es02node:docker compose up -d - Wait for the health checks to pass. Ensure the status changes to
Healthy.
4. Cluster Verification
1. Verify Cluster Nodes
- Execute the following command to check if all nodes have successfully joined the cluster:
curl --user "elastic:<password>" -k https://<es01-node-IP>:9200/_cat/nodes?v
2. Check Cluster Health
- Run the following command to confirm the cluster status is
green(healthy):curl --user "elastic:<password>" -k https://<es01-node-IP>:9200/_cat/health?v
3. Access Kibana
- Open a browser and navigate to:
http://<es01-node-IP>:5601 - Log in using the
elasticusername and password to verify the availability of the Kibana visualization interface.
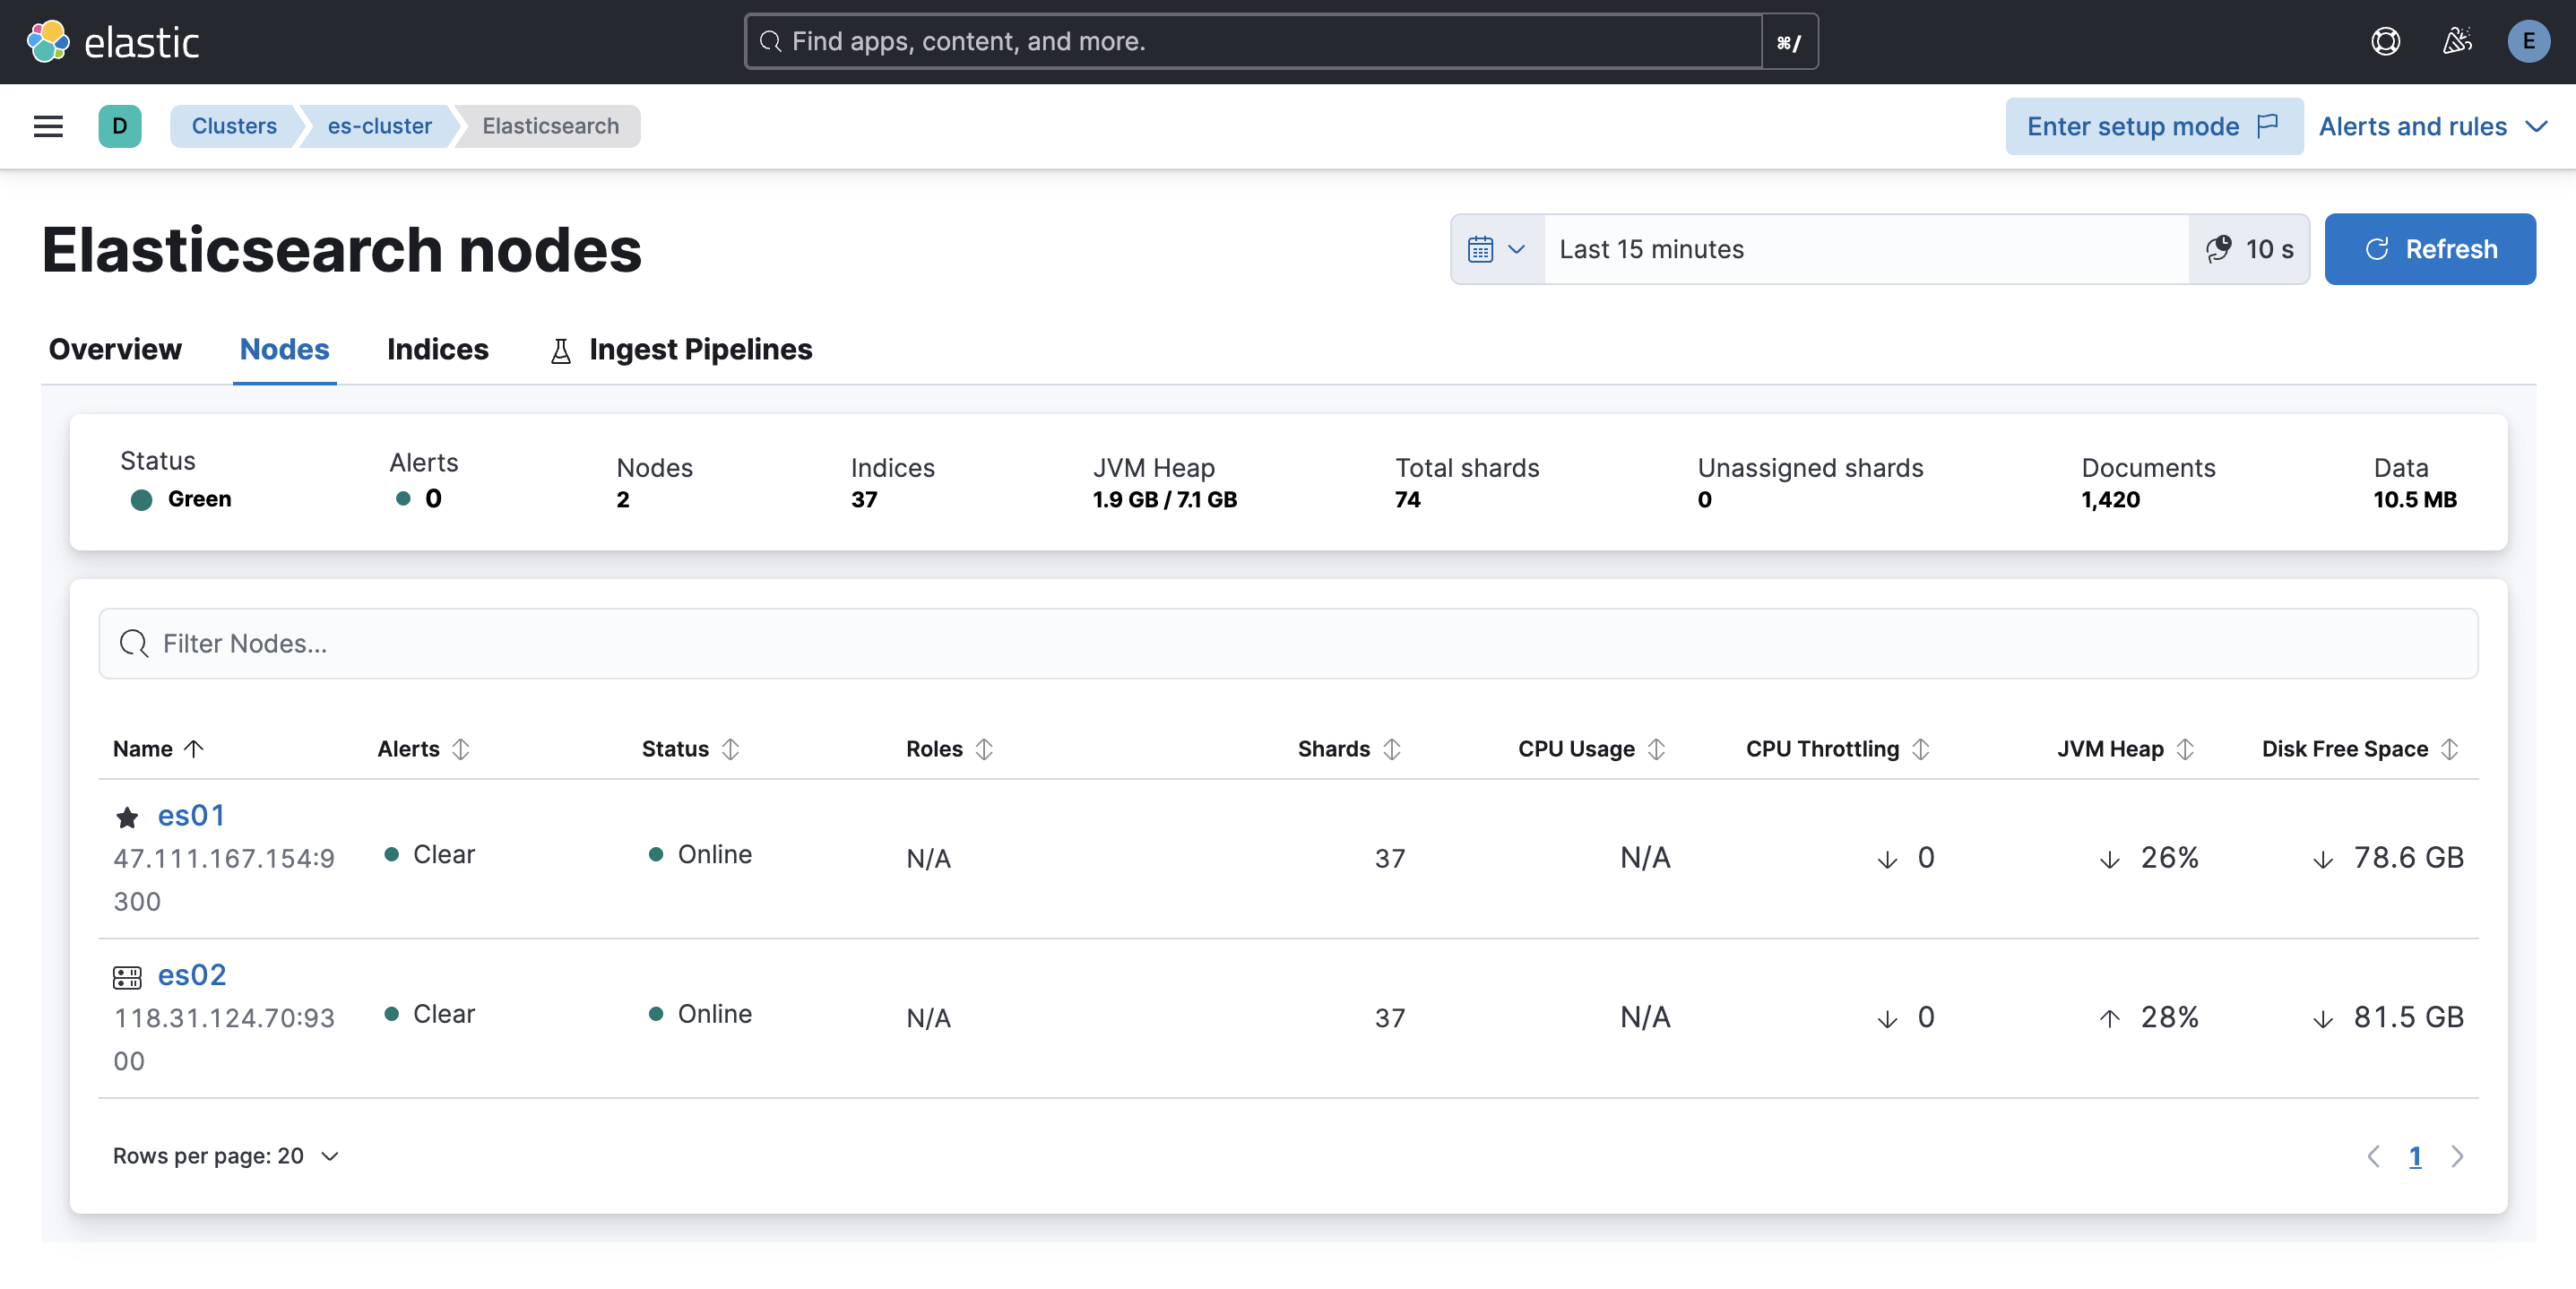
4. Client Read/Write Data Test
Below is an example Python script to test data read/write operations:
from elasticsearch import Elasticsearch
import ssl
import random
import time
import requests
requests.packages.urllib3.disable_warnings()

# Elasticsearch configuration
HOST = "https://ip1:9200"  # Elasticsearch address
USER = "elastic"  # Username
PASSWORD = "xxx"  # Password

def create_client():
    """
    Create an Elasticsearch client using self-signed certificates.
    """
    try:
        # Create Elasticsearch client
        client = Elasticsearch(
            hosts=[HOST],
            basic_auth=(USER, PASSWORD),
            verify_certs=False
        )
        print("Elasticsearch client created")
        return client
    except Exception as e:
        print(f"Error creating Elasticsearch client: {e}")
        raise

def main():
    client = create_client()

    # Test connection
    try:
        print("Testing connection...")
        if client.ping():
            print("Successfully connected to Elasticsearch!")
        else:
            print("Failed to connect to Elasticsearch!")
            return
    except Exception as e:
        print(f"Error connecting to Elasticsearch: {e}")
        return

    # Example: Create index
    index_name = "test-index"
    try:
        if not client.indices.exists(index=index_name):
            client.indices.create(index=index_name)
            print(f"Index {index_name} created")
    except Exception as e:
        print(f"Error creating index: {e}")
        return

    # Example: Randomly write 10 documents
    print("Writing data...")
    for i in range(10):
        doc = {
            "id": i,
            "message": f"Random message {i}",
            "value": random.randint(1, 100),
            "timestamp": time.strftime("%Y-%m-%dT%H:%M:%S")
        }
        try:
            response = client.index(index=index_name, document=doc)
            print(f"Document written, ID: {response['_id']}")
        except Exception as e:
            print(f"Error writing document: {e}")

    # Example: Read 10 documents
    print("Reading data...")
    try:
        response = client.search(index=index_name, query={"match_all": {}}, size=10)
        print(f"Search results: {len(response['hits']['hits'])} documents")
        for hit in response['hits']['hits']:
            print(hit['_source'])
    except Exception as e:
        print(f"Error reading documents: {e}")

if __name__ == "__main__":
    main()
System Overview
DeepTrace is a sophisticated distributed tracing framework designed for modern microservices architectures. This document provides a comprehensive overview of the system architecture, core components, and design principles.
Architecture Philosophy
DeepTrace is built on several key architectural principles:
1. Non-Intrusive Design
- Zero Code Changes: Applications require no modification
- eBPF-Based: Leverages kernel-level instrumentation
- Transparent Operation: Minimal impact on application behavior
2. Scalable Architecture
- Distributed Components: Agent-server architecture for scalability
- Horizontal Scaling: Components scale independently
- Efficient Data Flow: Optimized for high-throughput environments
3. Intelligent Correlation
- Transaction Semantics: Uses application-level transaction logic
- Multi-Dimensional Analysis: Combines temporal and semantic correlation
- Adaptive Algorithms: Adjusts to different application patterns
High-Level Architecture
graph TB
    subgraph "Microservices Cluster"
        subgraph "Host 1"
            APP1[Service A]
            APP2[Service B]
            AGENT1[DeepTrace Agent]
            APP1 -.-> AGENT1
            APP2 -.-> AGENT1
        end

        subgraph "Host 2"
            APP3[Service C]
            APP4[Service D]
            AGENT2[DeepTrace Agent]
            APP3 -.-> AGENT2
            APP4 -.-> AGENT2
        end

        subgraph "Host N"
            APPN[Service N]
            AGENTN[DeepTrace Agent]
            APPN -.-> AGENTN
        end
    end

    subgraph "DeepTrace Infrastructure"
        subgraph "Server Cluster"
            SERVER[DeepTrace Server]
            ASSEMBLER[Trace Assembler]
            API[Query API]
        end

        subgraph "Storage Layer"
            ES[(Elasticsearch)]
            CACHE[(Redis Cache)]
        end

        subgraph "Interface Layer"
            WEB[Web Dashboard]
            CLI[CLI Tools]
        end
    end

    AGENT1 --> ES
    AGENT2 --> ES
    AGENTN --> ES

    ES --> SERVER
    SERVER --> ASSEMBLER
    ASSEMBLER --> ES

    SERVER --> API
    API --> WEB
    API --> CLI

    ES --> WEB
    CACHE --> API
Core Components
1. DeepTrace Agent
The agent is deployed on each host and is responsible for:
Data Collection
- eBPF Programs: Kernel-level network monitoring
- System Call Interception: Captures network I/O operations
- Protocol Parsing: Extracts application-layer information
- Metadata Extraction: Collects timing and context information
Local Processing
- Span Construction: Builds individual request/response spans
- Span Correlation: Correlates related spans using transaction semantics
- Data Compression: Reduces transmission overhead
- Local Buffering: Handles temporary network issues
- Process Filtering: Monitors only relevant applications
Communication
- Direct Storage: Sends constructed spans directly to Elasticsearch
- Batch Processing: Efficient bulk data transmission to storage
- Connection Management: Maintains Elasticsearch connection health
- Configuration Management: Receives configuration from management interface
2. DeepTrace Server
The server provides centralized processing and management:
Data Management
- Data Retrieval: Pulls correlated spans from Elasticsearch for assembly
- Validation: Ensures data integrity and completeness during retrieval
- Query Optimization: Efficiently queries spans for trace assembly
- Batch Processing: Processes spans in optimized batches
Trace Assembly
- Graph Construction: Builds trace dependency graphs from correlated spans
- Path Analysis: Identifies complete request paths
- Optimization: Removes redundant or incorrect trace connections
- Validation: Ensures trace completeness and accuracy
3. Storage Layer
Elasticsearch Cluster
- Primary Storage: Stores all span and trace data
- Full-Text Search: Enables complex queries
- Time-Series Optimization: Efficient time-based queries
- Scalable Storage: Handles large data volumes
Redis Cache
- Query Acceleration: Caches frequent queries
- Session Management: Handles user sessions
- Real-Time Data: Stores live monitoring data
- Configuration Cache: Caches system configuration
4. Interface Layer
Web Dashboard
- Trace Visualization: Interactive trace exploration
- Service Maps: Dependency visualization
- Performance Metrics: Real-time performance monitoring
- Alert Management: Configurable alerting system
CLI Tools
- System Management: Command-line administration
- Batch Operations: Bulk data processing
- Automation: Scriptable operations
- Debugging: Diagnostic and troubleshooting tools
Data Flow Architecture
1. Span Collection and Correlation Flow
sequenceDiagram
    participant App as Application
    participant eBPF as eBPF Program
    participant Agent as DeepTrace Agent
    participant ES as Elasticsearch

    App->>eBPF: Network System Call
    eBPF->>eBPF: Extract Metadata
    eBPF->>Agent: Send Raw Data
    Agent->>Agent: Construct Span
    Agent->>Agent: Correlate Spans
    Agent->>Agent: Process & Buffer
    Agent->>ES: Store Correlated Spans
2. Trace Assembly Flow
sequenceDiagram
    participant Server as DeepTrace Server
    participant ES as Elasticsearch
    participant Assembler as Trace Assembler

    Server->>ES: Query Correlated Spans
    ES->>Server: Return Correlated Span Data
    Server->>Assembler: Process Correlated Spans
    Assembler->>Assembler: Build Complete Traces
    Assembler->>ES: Store Assembled Traces
3. Query Flow
sequenceDiagram
    participant User as User
    participant Web as Web Dashboard
    participant API as Query API
    participant Cache as Redis Cache
    participant ES as Elasticsearch

    User->>Web: Submit Query
    Web->>API: API Request
    API->>Cache: Check Cache
    alt Cache Hit
        Cache->>API: Return Cached Data
    else Cache Miss
        API->>ES: Execute Query
        ES->>API: Return Results
        API->>Cache: Cache Results
    end
    API->>Web: Return Data
    Web->>User: Display Results
Deployment Architectures
1. Single Host Deployment
Use Cases: Development, testing, small-scale deployments
graph TB
    subgraph "Single Host"
        APPS[Applications]
        AGENT[Agent]
        SERVER[Server]
        ES[Elasticsearch]
        WEB[Web UI]

        APPS --> AGENT
        AGENT --> ES
        ES --> SERVER
        SERVER --> ES
        ES --> WEB
    end
Characteristics:
- Simplified deployment and management
- Lower resource requirements
- Limited scalability
- Suitable for evaluation and development
2. Distributed Deployment
Use Cases: Production environments, large-scale systems
graph TB
    subgraph "Application Hosts"
        HOST1[Host 1<br/>Apps + Agent]
        HOST2[Host 2<br/>Apps + Agent]
        HOSTN[Host N<br/>Apps + Agent]
    end

    subgraph "DeepTrace Cluster"
        LB[Load Balancer]
        SERVER1[Server 1]
        SERVER2[Server 2]
        SERVERN[Server N]
    end

    subgraph "Storage Cluster"
        ES1[(ES Node 1)]
        ES2[(ES Node 2)]
        ESN[(ES Node N)]
    end

    HOST1 --> ES1
    HOST2 --> ES2
    HOSTN --> ESN

    ES1 --> LB
    ES2 --> LB
    ESN --> LB

    LB --> SERVER1
    LB --> SERVER2
    LB --> SERVERN

    SERVER1 --> ES1
    SERVER2 --> ES2
    SERVERN --> ESN
Characteristics:
- High availability and fault tolerance
- Horizontal scalability
- Load distribution
- Production-ready architecture
3. Kubernetes Deployment
Use Cases: Container orchestration environments
graph TB
    subgraph "Kubernetes Cluster"
        subgraph "Application Namespace"
            PODS[Application Pods]
            AGENTS[Agent DaemonSet]
        end

        subgraph "DeepTrace Namespace"
            SERVERS[Server Deployment]
            CONFIG[ConfigMaps]
            SECRETS[Secrets]
        end

        subgraph "Storage Namespace"
            ES_CLUSTER[Elasticsearch StatefulSet]
            PV[Persistent Volumes]
        end
    end

    PODS -.-> AGENTS
    AGENTS --> ES_CLUSTER
    ES_CLUSTER --> SERVERS
    SERVERS --> ES_CLUSTER
    CONFIG --> SERVERS
    SECRETS --> SERVERS
    ES_CLUSTER --> PV
Characteristics:
- Native Kubernetes integration
- Automatic scaling and healing
- Resource management
- Service discovery integration
Scalability Considerations
1. Agent Scalability
Horizontal Scaling
- Per-Host Deployment: One agent per host
- Process Isolation: Independent agent processes
- Resource Limits: Configurable resource constraints
- Load Distribution: Automatic workload balancing
Vertical Scaling
- Multi-Threading: Parallel span processing
- Memory Management: Efficient memory utilization
- CPU Optimization: Optimized eBPF programs
- I/O Efficiency: Batched network operations
2. Server Scalability
Horizontal Scaling
- Stateless Design: Servers can be added/removed dynamically
- Load Balancing: Distribute agent connections
- Partition Tolerance: Handle network partitions gracefully
- Auto-Scaling: Kubernetes-based automatic scaling
Vertical Scaling
- Parallel Processing: Multi-threaded correlation algorithms
- Memory Optimization: Efficient data structures
- CPU Utilization: Optimized algorithms
- Storage Optimization: Efficient Elasticsearch usage
3. Storage Scalability
Data Partitioning
- Time-Based Sharding: Partition by time periods
- Service-Based Sharding: Partition by service
- Hash-Based Sharding: Distribute by hash functions
- Hybrid Approaches: Combine multiple strategies
Performance Optimization
- Index Optimization: Efficient query indexes
- Compression: Data compression strategies
- Caching: Multi-level caching
- Archival: Automated data lifecycle management
Security Architecture
1. Data Protection
Encryption
- In-Transit: TLS encryption for all communications
- At-Rest: Elasticsearch encryption
- Key Management: Secure key rotation
- Certificate Management: Automated certificate lifecycle
Access Control
- Authentication: Multi-factor authentication
- Authorization: Role-based access control
- API Security: Secure API endpoints
- Audit Logging: Comprehensive audit trails
2. Network Security
Network Isolation
- VPC/VNET: Private network deployment
- Firewall Rules: Restrictive network policies
- Service Mesh: Encrypted service communication
- Network Monitoring: Traffic analysis and monitoring
Endpoint Security
- Agent Security: Secure agent deployment
- Server Hardening: Security-hardened servers
- Container Security: Secure container images
- Vulnerability Management: Regular security updates
Performance Characteristics
1. Throughput Metrics
| Component | Metric | Typical Value |
|---|---|---|
| Agent | Spans/second | 10,000-50,000 |
| Agent Correlation | Spans/minute | 1,000,000+ |
| Server | Assembly rate | 100,000-500,000 |
| Storage | Write throughput | 10,000-50,000 docs/sec |
2. Latency Metrics
| Operation | Typical Latency | Target SLA |
|---|---|---|
| Span Collection | 0.1-0.5ms | < 1ms |
| Span Correlation | 1-10ms | < 50ms |
| Data Transmission | 1-5ms | < 10ms |
| Trace Assembly | 100-500ms | < 1s |
| Query Response | 10-100ms | < 200ms |
This architectural overview provides the foundation for understanding DeepTrace's design and implementation. The modular, scalable architecture enables deployment across a wide range of environments while maintaining high performance and reliability.
Agent Architecture
The DeepTrace Agent is a lightweight, high-performance Rust-based component responsible for collecting distributed tracing data from applications without requiring code modifications. This document provides a detailed overview of the agent's architecture, components, and operational principles based on the actual implementation.
Overview
The DeepTrace Agent operates as a system-level service that uses eBPF (Extended Berkeley Packet Filter) technology to transparently capture network communications and system calls. It processes this raw data into structured spans and transmits them directly to Elasticsearch for storage and later processing by the DeepTrace Server.
Architecture Diagram
graph TB
    subgraph "Application Layer"
        APP1[Application 1]
        APP2[Application 2]
        APP3[Application 3]
    end

    subgraph "DeepTrace Agent"
        subgraph "eBPF Layer"
            TRACE_MODULE[TraceModule/TraceCollector]
            EBPF_PROGS[eBPF Programs]
            SYSCALLS[System Call Hooks]
        end

        subgraph "Processing Layer"
            SPAN_CONSTRUCTOR[SpanConstructor]
            MESSAGE_QUEUE[Message Queue]
        end

        subgraph "Sender Layer"
            SENDER_PROCESS[SenderProcess]
            ELASTIC_SENDER[ElasticSender]
            FILE_SENDER[FlatFile]
        end

        subgraph "Management Layer"
            CONFIGURATOR[Configurator]
            SYNCHRONIZER[Synchronizer]
            METRIC_COLLECTOR[MetricCollector]
            API_SERVER[Rocket API Server]
        end
    end

    subgraph "External Systems"
        ES[(Elasticsearch)]
        CONFIG_API[Configuration API]
    end

    APP1 --> SYSCALLS
    APP2 --> SYSCALLS
    APP3 --> SYSCALLS

    SYSCALLS --> EBPF_PROGS
    EBPF_PROGS --> TRACE_MODULE
    TRACE_MODULE --> MESSAGE_QUEUE
    MESSAGE_QUEUE --> SPAN_CONSTRUCTOR
    SPAN_CONSTRUCTOR --> SENDER_PROCESS
    SENDER_PROCESS --> ELASTIC_SENDER
    SENDER_PROCESS --> FILE_SENDER
    ELASTIC_SENDER --> ES

    CONFIGURATOR --> SPAN_CONSTRUCTOR
    CONFIGURATOR --> SENDER_PROCESS
    SYNCHRONIZER --> API_SERVER
    API_SERVER --> CONFIG_API
    METRIC_COLLECTOR --> FILE_SENDER
Core Components
1. eBPF Layer
The eBPF layer provides the foundation for non-intrusive data collection:
TraceModule/TraceCollector
- Purpose: Main eBPF program management and data collection
- Implementation: Rust-based eBPF program loader and manager
- Target Processes: Configurable via PIDs in configuration
- Data Collection: Network system calls and socket operations
System Call Hooks
- Monitored Calls:
- Read Operations:
sys_enter_read,sys_exit_read,sys_enter_readv,sys_exit_readv - Receive Operations:
sys_enter_recvfrom,sys_exit_recvfrom,sys_enter_recvmsg,sys_exit_recvmsg,sys_enter_recvmmsg,sys_exit_recvmmsg - Write Operations:
sys_enter_write,sys_exit_write,sys_enter_writev,sys_exit_writev - Send Operations:
sys_enter_sendto,sys_exit_sendto,sys_enter_sendmsg,sys_exit_sendmsg,sys_enter_sendmmsg,sys_exit_sendmmsg - Socket Operations:
sys_exit_socket,sys_enter_close
- Read Operations:
- Configuration: Enabled probes are configurable via
enabled_probesarray - Logging: Configurable log levels (0=off, 1=debug, 3=verbose, 4=stats)
eBPF Configuration
- Buffer Management:
max_buffered_events(default: 128) - Process Filtering: Target specific PIDs for monitoring
- Probe Selection: Granular control over which system calls to monitor
2. Processing Layer
The processing layer transforms raw eBPF events into structured spans:
SpanConstructor
- Purpose: Converts raw eBPF messages into structured spans
- Input: Receives messages from TraceModule via crossbeam channels
- Output: Sends constructed spans to SenderProcess
- Implementation: Rust-based message processing with configurable buffering
- Configuration:
cleanup_interval: Span cleanup timing (default: 30 seconds)max_sockets: Maximum tracked sockets (default: 1024)
Message Queue System
- Channel Type: Crossbeam unbounded/bounded channels
- Message Flow:
TraceModule → SpanConstructor → SenderProcess - Buffer Sizes: Configurable bounded channels (default: 1024)
- Backpressure: Automatic handling via channel capacity
Data Processing Features
- Socket Tracking: Maintains socket state across system calls
- Request/Response Correlation: Matches network I/O operations
- Span Correlation: Correlates related spans using transaction semantics
- Metadata Extraction: Process IDs, timestamps, connection details
- Span Lifecycle Management: Automatic cleanup of completed spans
3. Sender Layer
The sender layer handles data output to various destinations:
SenderProcess
- Purpose: Generic sender framework for different output types
- Implementation: Configurable sender that can use different backends
- Channel Integration: Receives spans from SpanConstructor via channels
- Supported Backends: Elasticsearch and File output
ElasticSender
- Purpose: Direct Elasticsearch integration for span storage
- Configuration:
node_url: Elasticsearch endpoint (e.g., "http://localhost:9200")username/password: Authentication credentialsindex_name: Target index for spansbulk_size: Batch size for bulk operations (default: 64)request_timeout: HTTP timeout (default: 10 seconds)
- Features: Bulk indexing, connection management, error handling
FlatFile Sender
- Purpose: File-based output for debugging and backup
- Configuration:
path: Output file pathrotate: Enable log rotationmax_size: Maximum file size before rotation (MB)max_age: Retention period (days)rotate_time: Rotation interval (days)data_format: Date format for file naming
- Features: Automatic rotation, compression, structured output
4. Management Layer
The management layer provides operational capabilities:
Configurator
- Purpose: Dynamic configuration management with file watching
- Features:
- File system watching for configuration changes
- Automatic reload on configuration file modifications
- Retry logic for handling file write delays
- Configuration validation and error handling
- Implementation: Uses
notifycrate for file system events - Configuration Path: Configurable via command line (
-cflag)
Synchronizer
- Purpose: Agent state synchronization and API management
- Features: Rocket-based HTTP API server for configuration updates
- API Endpoints:
/api/config/updatefor dynamic configuration - Configuration:
address: API server bind addressport: API server portworkers: Number of worker threadsident: Server identification string
MetricCollector
- Purpose: System and application metrics collection
- Configuration:
interval: Collection interval in secondssender: Target sender for metrics (references sender configuration)
- Output: Sends metrics to configured sender (typically file-based)
- Metrics: CPU usage, memory usage, span counts, system statistics
Data Flow
1. Event Capture
Application → System Call → eBPF Hook → TraceModule → Message Channel
2. Span Construction
Message Channel → SpanConstructor → Span Building → Span Channel
3. Data Output
Span Channel → SenderProcess → ElasticSender → Elasticsearch
                            → FlatFile → Local Files
4. Configuration Management
Config File → Configurator → Dynamic Reload → Component Updates
Configuration Structure
The agent uses a TOML-based configuration system with the following structure:
Core Configuration Sections
Agent Configuration
[agent]
name = "deeptrace"  # Agent identifier
eBPF Configuration
[ebpf.trace]
log_level = 1  # 0=off, 1=debug, 3=verbose, 4=stats
pids = [523094]  # Target process IDs
max_buffered_events = 128
enabled_probes = [
    "sys_enter_read", "sys_exit_read",
    "sys_enter_write", "sys_exit_write",
    # ... additional system call hooks
]
Trace Configuration
[trace]
ebpf = "trace"  # References ebpf configuration
sender = "trace"  # References sender configuration

[trace.span]
cleanup_interval = 30  # Span cleanup interval (seconds)
max_sockets = 1024     # Maximum tracked sockets
Sender Configuration
# Elasticsearch sender
[sender.elastic.trace]
node_url = "http://localhost:9200"
username = "elastic"
password = "***"
request_timeout = 10
index_name = "agent1"
bulk_size = 64

# File sender
[sender.file.metric]
path = "metrics.csv"
rotate = true
max_size = 512  # MB
max_age = 6     # days
rotate_time = 11  # days
data_format = "%Y%m%d"
Metrics Configuration
[metric]
interval = 10    # Collection interval (seconds)
sender = "metric" # References sender configuration
Security Considerations
Privilege Requirements
- CAP_BPF: Required for eBPF program loading (kernel 5.8+)
- CAP_SYS_ADMIN: Required for older kernels
- Root Access: Alternative to capabilities (not recommended)
Data Protection
- Payload Filtering: Configurable content-type exclusions
- Sensitive Data Masking: Automatic detection and redaction
- Encryption in Transit: TLS support for server communication
- Local Storage: Optional encryption for disk buffers
Attack Surface
- eBPF Verifier: Kernel-level safety guarantees
- User Space: Standard application security practices
- Network Communication: Standard HTTPS security
- Configuration: File system permissions and validation
Deployment and Usage
Command Line Usage
# Basic usage with default configuration
cargo run --release

# Specify custom configuration file
cargo run --release -- -c /path/to/config.toml

# With sudo privileges (required for eBPF)
sudo cargo run --release -- -c config/deeptrace.toml
Configuration File Location
- Default Path:
config/deeptrace.toml - Custom Path: Specified via
-ccommand line argument - Example Configuration:
config/deeptrace.toml.example
Runtime Requirements
- Privileges: Root or CAP_BPF capability for eBPF program loading
- Kernel Version: Linux kernel with eBPF support
- Dependencies: Rust runtime, libbpf, Elasticsearch (for data storage)
Process Management
- Startup: Agent initializes all modules sequentially
- Shutdown: Graceful shutdown on SIGINT (Ctrl+C)
- State Management: Atomic state management for clean shutdown
- Error Handling: Comprehensive error handling with logging
API Endpoints
The agent provides a REST API for configuration management:
Configuration Update
POST /api/config/update
Content-Type: application/json

{
  "agent": {
    "name": "deeptrace",
    "workers": 4
  },
  "sender": {
    "elastic": {
      "node_url": "http://localhost:9200",
      "username": "elastic",
      "password": "password",
      "index_name": "spans",
      "bulk_size": 64
    }
  },
  "trace": {
    "pids": [1234, 5678]
  }
}
API Configuration
# API server settings (part of synchronizer)
address = "0.0.0.0"  # Bind address
port = 8080          # API port
workers = 1          # Worker threads
ident = "deeptrace"  # Server identification
Module Architecture
The agent follows a modular architecture with the following key modules:
Core Modules
- TraceModule/TraceCollector: eBPF program management and data collection
- SpanConstructor: Raw event processing and span construction
- SenderProcess: Data output management with pluggable backends
- MetricCollector: System metrics collection and reporting
- Configurator: Dynamic configuration management
- Synchronizer: API server and state synchronization
Module Lifecycle
- Initialization: Sequential module startup with dependency management
- Runtime: Asynchronous operation with channel-based communication
- Shutdown: Graceful shutdown with proper resource cleanup
- Error Handling: Per-module error handling with system-wide error propagation
Inter-Module Communication
- Channels: Crossbeam channels for high-performance message passing
- Configuration: Shared configuration via Arc<ArcSwap
> - State Management: Atomic state management for coordination
- Error Propagation: Structured error handling across module boundaries
Server Architecture
The DeepTrace Server is a Python-based distributed system responsible for managing agents, processing correlated spans from Elasticsearch, performing trace assembly, and providing management interfaces. This document provides a detailed overview of the server's architecture, components, and operational principles based on the actual implementation.
Overview
The DeepTrace Server operates as a centralized control and processing system that:
- Manages Agent Lifecycle: Deploys, configures, and monitors distributed agents
- Processes Correlated Span Data: Retrieves correlated spans from Elasticsearch for assembly
- Performs Trace Assembly: Assembles correlated spans into complete distributed traces
- Provides Management Interface: Offers APIs and tools for system administration
Architecture Diagram
graph TB
    subgraph "DeepTrace Server"
        subgraph "Agent Management"
            AGENT_MGR[Agent Manager]
            SSH_CLIENT[SSH Client]
            DEPLOY[Deployment Controller]
        end

        subgraph "Data Processing"
            SPAN_POLLER[Span Poller]
            ASSEMBLER[Trace Assembler]
        end

        subgraph "Storage Interface"
            ES_CLIENT[Elasticsearch Client]
            DB_UTILS[Database Utils]
        end

        subgraph "Configuration"
            CONFIG_PARSER[Config Parser]
            TOML_CONFIG[TOML Configuration]
        end
    end

    subgraph "External Systems"
        AGENTS[Remote Agents]
        ES[(Elasticsearch)]
        SSH[SSH Hosts]
    end

    AGENT_MGR --> SSH_CLIENT
    SSH_CLIENT --> SSH
    SSH --> AGENTS
    DEPLOY --> AGENTS

    SPAN_POLLER --> ES_CLIENT
    ES_CLIENT --> ES
    SPAN_POLLER --> ASSEMBLER
    ASSEMBLER --> ES_CLIENT

    CONFIG_PARSER --> TOML_CONFIG
    CONFIG_PARSER --> AGENT_MGR
Core Components
1. Agent Management System
The server provides comprehensive agent lifecycle management:
Agent Class
- Purpose: Represents and manages individual agent instances
- Key Features:
- SSH-based remote command execution
- Configuration synchronization
- Code deployment and installation
- Process management (start/stop/restart)
- Health monitoring and status tracking
Agent Operations
class Agent:
    def __init__(self, agent_config, elastic_config, server_config):
        # SSH connection management
        self.ssh_client = None
        self.host_ip = agent_config['agent_info']['host_ip']
        self.ssh_port = agent_config['agent_info']['ssh_port']
        self.user_name = agent_config['agent_info']['user_name']
        self.host_password = agent_config['agent_info']['host_password']

    def clone_code(self):
        # Git clone from repository
        repo_url = 'https://gitee.com/gytlll/DeepTrace.git'

    def install(self):
        # Run installation script
        command = "bash scripts/install_agent.sh"

    def sync_config(self):
        # Generate and deploy TOML configuration

    def run(self):
        # Start agent process
        command = "bash scripts/run_agent.sh"

    def stop(self):
        # Stop agent process
        command = "bash scripts/stop_agent.sh"
Configuration Management
- Dynamic Configuration: Generates agent-specific TOML configurations
- Hot Reload: Supports runtime configuration updates via API
- Template System: Uses server configuration to generate agent configs
- Validation: Ensures configuration consistency across agents
2. Data Processing Pipeline
The server implements a sophisticated data processing pipeline:
Span Polling
- Purpose: Continuously retrieves new spans from Elasticsearch
- Implementation:
poll_agents_new_spans()function - Features:
- Multi-agent span collection
- Configurable polling intervals
- Queue-based processing
- Error handling and retry logic
Trace Assembly Engine
def span2trace(correlated_spans):
    # Step 1: Process correlated spans
    spans = process_correlated_spans(correlated_spans)

    # Step 2: Span merging
    span_list = span_merge(spans)

    # Step 3: Trace assembly
    trace_num = assemble_trace_from_spans(span_list, 'traces')
Processing Components
- Span Processing: Processes correlated spans from agents
- Span Merge: Consolidates related spans
- Trace Assembler: Builds complete trace structures from correlated spans
3. Storage Interface
The server provides comprehensive Elasticsearch integration:
Database Utilities
- Connection Management: Elasticsearch client initialization
- Index Management: Automatic index creation and management
- Bulk Operations: Efficient batch data operations
- Query Interface: Structured query building and execution
Key Functions
def es_write_agent_config(agent_config, elastic_config, server_config):
    # Store agent configuration in Elasticsearch

def poll_agents_new_spans(agents, queue, interval):
    # Retrieve new spans from multiple agents

def check_db():
    # Verify database connectivity and health
4. Configuration System
The server uses a TOML-based configuration system:
Configuration Structure
[elastic]
elastic_password = "password"  # Elasticsearch authentication

[server]
ip = "server_ip"              # Server external IP

[[agents]]
  [agents.agent_info]
  agent_name = "agent1"        # Unique agent identifier
  user_name = "username"       # SSH username
  host_ip = "agent_ip"         # Agent host IP
  ssh_port = 22                # SSH port
  host_password = "password"   # SSH password
Configuration Features
- Multi-Agent Support: Array-based agent configuration
- Environment Specific: Separate configs for different environments
- Validation: Schema validation and error handling
- Dynamic Loading: Runtime configuration reloading
Data Flow Architecture
1. Agent Management Flow
Configuration → Agent Creation → SSH Connection → Remote Operations
2. Span Processing Flow
Elasticsearch → Span Polling → Queue → Assembly → Storage
3. Deployment Flow
Config Parsing → Agent Initialization → Code Clone → Installation → Configuration Sync → Agent Start
Operational Modes
The server supports different operational modes:
Automatic Mode
- Default Operation: Continuous correlated span processing
- Background Processing: Automated trace assembly
- Health Monitoring: Continuous agent health checks
Manual Mode
- Interactive Control: Manual agent management
- Debug Mode: Enhanced logging and debugging
- Maintenance Mode: System maintenance operations
Management Interface
Command Line Interface
The server provides various management utilities:
Agent Management
def install_agents(agents):
    # Parallel agent installation

def start_agents(agents):
    # Start all configured agents

def stop_agents(agents):
    # Stop all running agents

def update_agent_config(agents):
    # Hot reload agent configurations

def test_agents(agents):
    # Test agent connectivity and health
Monitoring Functions
- Health Checks: Agent connectivity and status monitoring
- Performance Metrics: Processing statistics and performance data
- Error Tracking: Comprehensive error logging and tracking
- Resource Monitoring: System resource usage tracking
Deployment Architecture
Server Requirements
- Python Runtime: Python 3.x with required dependencies
- Network Access: SSH access to agent hosts
- Elasticsearch: Connection to Elasticsearch cluster
- Configuration: Proper TOML configuration files
Agent Deployment Process
- Code Distribution: Git clone from central repository
- Installation: Automated installation via scripts
- Configuration: Dynamic configuration generation and deployment
- Service Management: Systemd or process-based service management
- Health Monitoring: Continuous health and status monitoring
Security Considerations
Authentication and Authorization
- SSH Key Management: Secure SSH key-based authentication
- Elasticsearch Security: Secure Elasticsearch connections
- Configuration Security: Encrypted configuration storage
- Network Security: Secure network communications
Data Protection
- Encryption in Transit: TLS/SSL for all network communications
- Access Control: Role-based access control for server operations
- Audit Logging: Comprehensive audit trails for all operations
- Credential Management: Secure credential storage and rotation
Performance Characteristics
Processing Capacity
- Span Throughput: Processes thousands of correlated spans per minute
- Assembly Performance: Efficient trace assembly algorithms
- Storage Performance: Optimized Elasticsearch operations
- Agent Management: Concurrent agent operations
Scalability Features
- Horizontal Scaling: Multiple server instances for load distribution
- Agent Scaling: Support for hundreds of distributed agents
- Storage Scaling: Elasticsearch cluster scaling support
- Processing Scaling: Parallel processing capabilities
Troubleshooting and Monitoring
Common Issues
Agent Connectivity
# Test SSH connectivity
ssh user@agent_host

# Check agent status
sudo systemctl status deeptrace-agent

# View agent logs
sudo journalctl -u deeptrace-agent -f
Processing Issues
# Check Elasticsearch connectivity
from elasticsearch import Elasticsearch
es = Elasticsearch([{'host': 'localhost', 'port': 9200}])
print(es.ping())

# Monitor span processing
log(f"Processing {len(spans)} spans")
log(f"Assembled {trace_num} traces")
Monitoring Best Practices
- Health Monitoring: Regular agent health checks
- Performance Monitoring: Track processing metrics
- Error Monitoring: Monitor error rates and patterns
- Resource Monitoring: Track system resource usage
- Log Analysis: Regular log analysis for issues
Integration Points
External Systems
- Elasticsearch: Primary data storage and retrieval
- Git Repository: Source code management and distribution
- SSH Infrastructure: Remote agent management
- Monitoring Systems: Integration with external monitoring
API Interfaces
- Agent APIs: Communication with agent REST APIs
- Elasticsearch APIs: Direct Elasticsearch integration
- Management APIs: Server management and control interfaces
- Monitoring APIs: Health and status reporting interfaces
This server architecture provides a comprehensive foundation for distributed tracing management, offering scalable agent management, efficient data processing, and robust operational capabilities.
eBPF Overview
DeepTrace's eBPF implementation provides non-intrusive distributed tracing through kernel-level network monitoring. The implementation is built using the Aya framework and consists of multiple specialized eBPF programs for different system observability aspects.
Architecture Overview
DeepTrace's eBPF implementation follows a modular architecture with specialized programs for different observability domains:
graph TB
    subgraph "eBPF Programs"
        TRACE[observ-trace-ebpf<br/>Network Tracing]
        CPU[observ-cpu-ebpf<br/>CPU Monitoring]
        MEMORY[observ-memory-ebpf<br/>Memory Monitoring]
        DISK[observ-disk-ebpf<br/>Disk I/O Monitoring]
        NETWORK[observ-network-ebpf<br/>Network Monitoring]
    end

    subgraph "Common Infrastructure"
        COMMON[ebpf-common<br/>Shared Components]
        TRACE_COMMON[observ-trace-common<br/>Trace Data Structures]
    end

    subgraph "User Space"
        AGENT[DeepTrace Agent]
        MANAGER[eBPF Manager]
    end

    TRACE --> COMMON
    CPU --> COMMON
    MEMORY --> COMMON
    DISK --> COMMON
    NETWORK --> COMMON

    TRACE --> TRACE_COMMON

    AGENT --> MANAGER
    MANAGER --> TRACE
    MANAGER --> CPU
    MANAGER --> MEMORY
    MANAGER --> DISK
    MANAGER --> NETWORK
Core Components
1. observ-trace-ebpf - Network Tracing
The primary eBPF program for distributed tracing, monitoring network system calls:
Monitored System Calls:
- Ingress:
read,readv,recvfrom,recvmsg,recvmmsg - Egress:
write,writev,sendto,sendmsg,sendmmsg - Socket Management:
socket,close
Key Features:
- Tracepoint-based system call interception
- Protocol-aware payload extraction
- TCP sequence number tracking
- Process filtering by PID
- Real-time span correlation
2. ebpf-common - Shared Infrastructure
Provides common functionality used across all eBPF programs:
Core Modules:
- CO-RE Support: Kernel compatibility across versions
- Buffer Management: Efficient data handling
- Memory Allocation: eBPF-safe memory management
- Error Handling: Comprehensive error codes
- Utility Functions: Common helper functions
3. observ-trace-common - Trace Data Structures
Defines shared data structures between eBPF and user space:
Key Structures:
Message: Complete trace recordQuintuple: Network flow identifierSocketInfo: Socket metadataDirection: Ingress/Egress classificationSyscall: System call enumeration
4. Additional Observability Programs
- observ-cpu-ebpf: CPU performance monitoring
- observ-memory-ebpf: Memory usage tracking
- observ-disk-ebpf: Disk I/O monitoring
- observ-network-ebpf: Network statistics
Implementation Framework
Aya Framework
DeepTrace uses the Aya eBPF framework, providing:
- Rust-native eBPF development
- Type-safe eBPF programming
- Automatic BTF generation
- CO-RE (Compile Once, Run Everywhere) support (use libbpf)
- Integration with Rust ecosystem
Tracepoint-Based Monitoring
Uses Linux tracepoints for system call interception:
#![allow(unused)]
fn main() {
#[tracepoint(category = "syscalls", name = "sys_enter_read")]
fn sys_enter_read(ctx: TracePointContext) -> u32 {
    // Entry point processing
}

#[tracepoint(category = "syscalls", name = "sys_exit_read")]
fn sys_exit_read(ctx: TracePointContext) -> u32 {
    // Exit point processing
}
}
Data Flow Architecture
1. System Call Interception
sequenceDiagram
    participant App as Application
    participant Kernel as Linux Kernel
    participant eBPF as eBPF Program
    participant Agent as User Space Agent

    App->>Kernel: System Call (read/write)
    Kernel->>eBPF: Tracepoint Trigger (enter)
    eBPF->>eBPF: Store Context in Map
    Kernel->>Kernel: Execute System Call
    Kernel->>eBPF: Tracepoint Trigger (exit)
    eBPF->>eBPF: Extract Data & Correlate
    eBPF->>Agent: Send Message via PerfEvent
2. Data Processing Pipeline
- Entry Phase: Store system call context
- Execution Phase: Kernel processes the system call
- Exit Phase: Extract data and build trace message
- Correlation Phase: Apply protocol inference and correlation
- Transmission Phase: Send to user space via PerfEvent
Memory Management
eBPF Maps
DeepTrace uses several types of eBPF maps:
#![allow(unused)]
fn main() {
// Process filtering
#[map(name = "PIDS")]
pub static mut PIDS: HashMap<u32, u32> = HashMap::with_max_entries(256, 0);

// System call context storage
#[map(name = "ingress")]
pub static mut INGRESS: HashMap<u64, Args> = HashMap::with_max_entries(1024, 0);

#[map(name = "egress")]
pub static mut EGRESS: HashMap<u64, Args> = HashMap::with_max_entries(1024, 0);

// Data transmission
#[map(name = "EVENTS")]
pub static mut EVENTS: PerfEventByteArray = PerfEventByteArray::new(0);
}
Memory Allocation
Uses custom eBPF-safe allocator from ebpf-common:
#![allow(unused)]
fn main() {
// Initialize allocator
alloc::init()?;

// Allocate zero-initialized memory
let data = alloc::alloc_zero::<Message>()?;
let buffer = alloc::alloc_zero::<Buffer<MAX_INFER_SIZE>>()?;
}
Protocol Support
L7 Protocol Inference
Integrated with l7-parser for protocol detection:
#![allow(unused)]
fn main() {
let result = protocol_infer(
    ctx,
    &quintuple,
    direction,
    infer_payload,
    key,
    args.enter_seq,
    data.exit_seq,
)?;
}
Supported Protocols:
- HTTP/HTTPS
- gRPC
- Redis
- MongoDB
- MySQL
- PostgreSQL
- And more...
Performance Characteristics
Overhead Metrics
| Component | Overhead | Impact |
|---|---|---|
| System Call Interception | 2-4μs | Per syscall |
| Data Extraction | 1-2μs | Per payload |
| Protocol Inference | 0.5-1μs | Per message |
| Map Operations | 0.1-0.5μs | Per operation |
Optimization Features
- Process Filtering: Monitor only relevant processes
- Payload Size Limits: Configurable data capture
- Batch Processing: Efficient data transmission
- Zero-Copy Operations: Minimize memory overhead
Error Handling
Comprehensive error handling with specific error codes:
#![allow(unused)]
fn main() {
pub const MAP_INSERT_FAILED: u32 = 1;
pub const MAP_DELETE_FAILED: u32 = 2;
pub const MAP_GET_FAILED: u32 = 3;
pub const INVALID_DIRECTION: u32 = 4;
pub const SYSCALL_PAYLOAD_LENGTH_INVALID: u32 = 5;
}
Development and Debugging
Build System
Uses cargo xtask for eBPF compilation:
# Build eBPF programs
cargo xtask build --profile release

# Build with debug information
cargo xtask build --profile debug
Debugging Tools
- aya-log: Structured logging from eBPF
- bpftool: eBPF program inspection
- perf: Performance analysis
- Custom debug counters: Runtime statistics
Next Steps
- System Hooks: Detailed system call implementation
- Data Structures: eBPF data structure reference
- Memory Maps: eBPF map configuration and usage
- Performance Analysis: Performance tuning and optimization
System Hooks
DeepTrace's eBPF implementation uses tracepoint-based system call hooks to intercept and monitor network operations. Built with the Aya framework, these hooks provide non-intrusive monitoring of network I/O operations for distributed tracing.
Hook Architecture
DeepTrace employs a dual-phase tracepoint strategy using Linux tracepoints:
- Entry Tracepoints (
sys_enter_*): Capture system call parameters and context - Exit Tracepoints (
sys_exit_*): Extract actual data and build trace messages
graph LR
    APP[Application] --> SYSCALL[System Call]
    SYSCALL --> ENTER[sys_enter_* Tracepoint]
    ENTER --> KERNEL[Kernel Processing]
    KERNEL --> EXIT[sys_exit_* Tracepoint]
    EXIT --> USERSPACE[User Space Agent]
Implementation Framework
Aya Tracepoint Macros
DeepTrace uses Aya's tracepoint macros for hook implementation:
#![allow(unused)]
fn main() {
use aya_ebpf::{
    macros::tracepoint,
    programs::TracePointContext,
};

#[tracepoint(category = "syscalls", name = "sys_enter_read")]
fn sys_enter_read(ctx: TracePointContext) -> u32 {
    // Entry processing logic
}

#[tracepoint(category = "syscalls", name = "sys_exit_read")]
fn sys_exit_read(ctx: TracePointContext) -> u32 {
    // Exit processing logic
}
}
Monitored System Calls
DeepTrace monitors 10 critical network system calls divided into two categories:
Ingress Operations (Data Receiving)
These hooks capture incoming network data and responses:
1. read() System Call
Purpose: Monitor data reading from file descriptors
Implementation Location: observ-trace-ebpf/src/read.rs
Entry Hook:
#![allow(unused)]
fn main() {
#[tracepoint(category = "syscalls", name = "sys_enter_read")]
fn sys_enter_read(ctx: TracePointContext) -> u32 {
    if !is_filtered_pid() {
        return 0;
    }

    let timestamp = unsafe { bpf_ktime_get_ns() };
    let Ok(fd) = (unsafe { ctx.read_at::<c_ulong>(16) }) else { return 0 };
    if fd < 3 {
        return 0;  // Skip stdin, stdout, stderr
    }

    let buf = match unsafe { ctx.read_at::<c_ulong>(24) } {
        Ok(buf) if buf != 0 => buf as *mut u8,
        _ => return 0,
    };

    let count = match unsafe { ctx.read_at::<c_ulong>(32) } {
        Ok(count) if count != 0 => count as u32,
        _ => return 0,
    };

    let Ok(seq) = read_seq(fd) else { return 0 };
    let args = Args::from_ubuf(fd, buf, count, timestamp, seq);
    try_or_log!(&ctx, try_enter(args, Direction::Ingress))
}
}
Exit Hook:
#![allow(unused)]
fn main() {
#[tracepoint(category = "syscalls", name = "sys_exit_read")]
fn sys_exit_read(ctx: TracePointContext) -> u32 {
    if !is_filtered_pid() {
        return 0;
    }

    let Ok(ret) = (unsafe { ctx.read_at::<c_long>(16) }) else { return 0 };
    try_or_log!(&ctx, try_exit(&ctx, ret, Syscall::Read, Direction::Ingress))
}
}
Captured Data:
- File descriptor (offset 16)
- Buffer pointer (offset 24)
- Read count (offset 32)
- Return value (bytes read)
- TCP sequence number
- Timestamp information
2. recvmsg() System Call
Purpose: Intercept message reception from sockets
Implementation Location: observ-trace-ebpf/src/recvmsg.rs
Entry Hook:
#![allow(unused)]
fn main() {
#[tracepoint(category = "syscalls", name = "sys_enter_recvmsg")]
fn sys_enter_recvmsg(ctx: TracePointContext) -> u32 {
    if !is_filtered_pid() {
        return 0;
    }

    let timestamp = unsafe { bpf_ktime_get_ns() };
    let Ok(fd) = (unsafe { ctx.read_at::<c_ulong>(16) }) else { return 0 };

    // Extract msghdr structure using CO-RE
    let (vec, vlen) = match unsafe { ctx.read_at::<c_ulong>(24) } {
        Ok(msg) if msg != 0 => {
            let msg = user_msghdr::from_ptr(msg as *const _);
            match (msg.msg_iov(), msg.msg_iovlen()) {
                (Some(vec), Some(vlen)) if !vec.is_null() && vlen != 0 =>
                    (vec, vlen as u32),
                _ => return 0,
            }
        },
        _ => return 0,
    };

    let Ok(seq) = read_seq(fd) else { return 0 };
    let args = Args::from_msg(fd, vec, vlen, timestamp, seq);
    try_or_log!(&ctx, try_enter(args, Direction::Ingress))
}
}
Key Features:
- CO-RE Support: Uses
user_msghdrfor kernel compatibility - iovec Extraction: Extracts
msg_iovandmsg_iovlenfields - Type Safety: Rust-based implementation with error handling
- Memory Safety: Safe pointer handling with null checks
Data Extraction:
- fd (offset 16): File descriptor
- msg (offset 24): Pointer to
user_msghdrstructure - msg_iov: Vector of I/O buffers (
iovecarray) - msg_iovlen: Number of
iovecentries
3. recvmmsg() System Call
Purpose: Monitor multiple message reception
Advantages:
- Batch processing efficiency
- Reduced system call overhead
- Better performance for high-throughput applications
4. readv() System Call
Purpose: Vectored read operations
Special Handling:
- Multiple buffer support
- Scatter-gather I/O
- Complex buffer reconstruction
5. recvfrom() System Call
Purpose: Receive data with source address information
Additional Data:
- Source address extraction
- UDP packet handling
- Connectionless protocol support
Egress Operations (Data Sending)
These hooks capture outgoing network data and requests:
6. write() System Call
Purpose: Monitor data writing to file descriptors
Implementation Location: observ-trace-ebpf/src/write.rs
Entry Hook:
#![allow(unused)]
fn main() {
#[tracepoint(category = "syscalls", name = "sys_enter_write")]
fn sys_enter_write(ctx: TracePointContext) -> u32 {
    if !is_filtered_pid() {
        return 0;
    }

    let timestamp = unsafe { bpf_ktime_get_ns() };
    let Ok(fd) = (unsafe { ctx.read_at::<c_ulong>(16) }) else { return 0 };
    if fd < 3 {
        return 0;  // Skip stdin, stdout, stderr
    }

    let buf = match unsafe { ctx.read_at::<c_ulong>(24) } {
        Ok(buf) if buf != 0 => buf as *mut u8,
        _ => return 0,
    };

    let count = match unsafe { ctx.read_at::<c_ulong>(32) } {
        Ok(count) if count != 0 => count as u32,
        _ => return 0,
    };

    let Ok(seq) = write_seq(fd) else { return 0 };
    let args = Args::from_ubuf(fd, buf, count, timestamp, seq);
    try_or_log!(&ctx, try_enter(args, Direction::Egress))
}
}
Exit Hook:
#![allow(unused)]
fn main() {
#[tracepoint(category = "syscalls", name = "sys_exit_write")]
fn sys_exit_write(ctx: TracePointContext) -> u32 {
    if !is_filtered_pid() {
        return 0;
    }

    let Ok(ret) = (unsafe { ctx.read_at::<c_long>(16) }) else { return 0 };
    try_or_log!(&ctx, try_exit(&ctx, ret, Syscall::Write, Direction::Egress))
}
}
Key Features:
- Process Filtering: Only monitors filtered PIDs
- FD Validation: Skips standard I/O file descriptors (0, 1, 2)
- Write Sequence: Tracks TCP write sequence numbers
- Type Safety: Rust-based implementation with error handling
- Memory Safety: Safe pointer handling and validation
Captured Data:
- fd (offset 16): File descriptor
- buf (offset 24): Buffer pointer
- count (offset 32): Write count
- Return value: Bytes written
- TCP sequence number: For correlation
7. sendmsg() System Call
Purpose: Intercept message transmission through sockets
Implementation Location: observ-trace-ebpf/src/sendmsg.rs
Entry Hook:
#![allow(unused)]
fn main() {
#[tracepoint(category = "syscalls", name = "sys_enter_sendmsg")]
fn sys_enter_sendmsg(ctx: TracePointContext) -> u32 {
    if !is_filtered_pid() {
        return 0;
    }

    let timestamp = unsafe { bpf_ktime_get_ns() };
    let Ok(fd) = (unsafe { ctx.read_at::<c_ulong>(16) }) else { return 0 };

    // Extract msghdr structure using CO-RE
    let (vec, vlen) = match unsafe { ctx.read_at::<c_ulong>(24) } {
        Ok(msg) if msg != 0 => {
            let msg = user_msghdr::from_ptr(msg as *const _);
            match (msg.msg_iov(), msg.msg_iovlen()) {
                (Some(vec), Some(vlen)) if !vec.is_null() && vlen != 0 =>
                    (vec, vlen as u32),
                _ => return 0,
            }
        },
        _ => return 0,
    };

    let Ok(seq) = write_seq(fd) else { return 0 };
    let args = Args::from_msg(fd, vec, vlen, timestamp, seq);
    try_or_log!(&ctx, try_enter(args, Direction::Egress))
}
}
Key Features:
- CO-RE Support: Uses
user_msghdrfor kernel compatibility - iovec Processing: Handles vectored I/O operations
- Write Sequence: Tracks TCP write sequence numbers
- Type Safety: Rust-based implementation with error handling
8. sendmmsg() System Call
Purpose: Monitor multiple message transmission
Benefits:
- Batch operation support
- High-performance scenarios
- Reduced kernel transitions
9. writev() System Call
Purpose: Vectored write operations
Complexity:
- Multiple buffer aggregation
- Efficient data reconstruction
- Memory-efficient processing
10. sendto() System Call
Purpose: Send data to specific destinations
Use Cases:
- UDP communication
- Connectionless protocols
- Direct addressing
Hook Implementation Details
Entry Phase Processing
When a system call enters, the hook performs:
#![allow(unused)]
fn main() {
// From process.rs
#[inline(always)]
pub fn try_enter(args: Args, direction: Direction) -> Result<u32> {
    let id = bpf_get_current_pid_tgid();

    // 1. Select appropriate map based on direction
    let map = match direction {
        Direction::Ingress => unsafe { &INGRESS },
        Direction::Egress => unsafe { &EGRESS },
        Direction::Unknown => return Err(INVALID_DIRECTION),
    };

    // 2. Store context for exit processing
    map.insert(&id, &args, 0).map_err(|_| MAP_INSERT_FAILED)?;
    Ok(0)
}
}
Entry Processing Steps:
- Process Filtering: Check
is_filtered_pid()before processing - Timestamp Capture: Record entry time with
bpf_ktime_get_ns() - Parameter Extraction: Extract fd, buffer, and count from tracepoint context
- Sequence Number: Get TCP sequence number for correlation
- Args Construction: Build
Argsstructure with all context - Map Storage: Store in INGRESS or EGRESS map for exit processing
Exit Phase Processing
When a system call exits, the hook performs:
#![allow(unused)]
fn main() {
// From process.rs
#[inline(always)]
pub fn try_exit(
    ctx: &TracePointContext,
    ret: c_long,
    syscall: Syscall,
    direction: Direction,
) -> Result<u32> {
    let id = bpf_get_current_pid_tgid();
    let map = match direction {
        Direction::Ingress => unsafe { &INGRESS },
        Direction::Egress => unsafe { &EGRESS },
        Direction::Unknown => return Err(INVALID_DIRECTION),
    };

    // 1. Validate return value
    if !(0 < ret && ret <= MAX_PAYLOAD_SIZE as i64) {
        debug!(ctx, "invalid ret: {}", ret);
        map.remove(&id).map_err(|_| MAP_DELETE_FAILED)?;
        return Err(SYSCALL_PAYLOAD_LENGTH_INVALID);
    }

    // 2. Retrieve stored context
    let args = match unsafe { map.get(&id) } {
        Some(a) => a,
        None => return Err(MAP_GET_FAILED),
    };

    // 3. Allocate and build Message structure
    alloc::init()?;
    let data = alloc::alloc_zero::<Message>()?;
    let sock = tcp_sock_from_fd(args.fd)?;
    let key = gen_connect_key(bpf_get_current_pid_tgid(), args.fd);

    // 4. Extract network information
    let quintuple = quintuple_from_sock(sock)?;
    data.quintuple = quintuple;
    data.quintuple.l4_protocol = is_tcp_udp(sock)?;

    // 5. Fill message fields
    data.tgid = ctx.tgid();
    data.pid = ctx.pid();
    data.comm = Buffer::from_slice(&ctx.command().map_err(|_| FAILED_TO_GET_COMM)?);
    data.enter_seq = args.enter_seq;
    data.exit_seq = match direction {
        Direction::Ingress => sock.copied_seq().ok_or(READ_TCP_SOCK_COPIED_SEQ_FAILED)?,
        Direction::Egress => sock.write_seq().ok_or(READ_TCP_SOCK_WRITE_SEQ_FAILED)?,
        _ => return Err(INVALID_DIRECTION),
    };

    // 6. Protocol inference and correlation
    let infer_payload = alloc::alloc_zero::<Buffer<MAX_INFER_SIZE>>()?;
    args.extract(infer_payload, ret as u32)?;

    let result = protocol_infer(
        ctx,
        &quintuple,
        direction,
        infer_payload,
        key,
        args.enter_seq,
        data.exit_seq,
    )?;

    data.timestamp_ns = unsafe { bpf_ktime_get_ns() };
    data.syscall = syscall;
    data.direction = direction;
    data.type_ = result.type_;
    data.protocol = result.protocol;
    data.seq = result.seq;
    data.uuid = result.uuid;

    // 7. Extract full payload
    args.extract(&mut data.payload, ret as u32)?;

    // 8. Cleanup and send
    map.remove(&id).map_err(|_| MAP_DELETE_FAILED)?;
    unsafe { EVENTS.output(ctx, data.encode(), 0) };

    Ok(0)
}
}
Exit Processing Steps:
- Return Value Validation: Check if return value is valid (0 < ret <= MAX_PAYLOAD_SIZE)
- Context Retrieval: Get stored Args from INGRESS/EGRESS map
- Memory Allocation: Allocate Message structure using eBPF-safe allocator
- Socket Information: Extract TCP socket and network quintuple
- Process Information: Get PID, TGID, and command name
- TCP Sequence Numbers: Get entry and exit sequence numbers for correlation
- Protocol Inference: Analyze payload for L7 protocol detection
- Payload Extraction: Copy actual network data to message
- Data Transmission: Send complete message to user space via PerfEvent
- Cleanup: Remove entry from map to prevent memory leaks
Process Filtering
DeepTrace implements intelligent process filtering to reduce overhead:
PID-Based Filtering
#![allow(unused)]
fn main() {
// From utils.rs
/// Check if the pid is in pid_map, which is generated by agent at user space
#[inline(always)]
pub(crate) fn is_filtered_pid() -> bool {
    let tgid = (bpf_get_current_pid_tgid() >> 32) as u32;
    unsafe { PIDS.get_ptr(&tgid) }.is_some()
}
}
Key Features:
- User Space Control: PID list managed by DeepTrace agent
- Fast Lookup: O(1) hash map lookup for PID filtering
- Thread Group ID: Uses TGID (process ID) rather than individual thread IDs
- Memory Efficient: Only stores PIDs that need monitoring
Socket Management
DeepTrace also provides socket lifecycle management:
#![allow(unused)]
fn main() {
// From process.rs
#[inline(always)]
pub fn try_socket(fd: u64) -> Result<u32> {
    let key = gen_connect_key(bpf_get_current_pid_tgid(), fd);
    let map = unsafe { &SOCKET_INFO };
    alloc::init()?;
    let socket_info = alloc::alloc_zero::<SocketInfo>()?;
    map.insert(&key, socket_info, 0).map_err(|_| MAP_INSERT_FAILED)?;
    Ok(0)
}

#[inline(always)]
pub fn try_close(fd: u64) -> Result<u32> {
    let key = gen_connect_key(bpf_get_current_pid_tgid(), fd);
    let map = unsafe { &SOCKET_INFO };
    if unsafe { map.get(&key) }.is_some() {
        map.remove(&key).map_err(|_| MAP_DELETE_FAILED)?;
    }
    Ok(0)
}
}
Protocol Inference and Correlation
DeepTrace integrates with l7-parser for protocol detection and correlation:
#![allow(unused)]
fn main() {
// From process.rs - Protocol inference
let result = protocol_infer(
    ctx,
    &quintuple,
    direction,
    infer_payload,
    key,
    args.enter_seq,
    data.exit_seq,
)?;

data.type_ = result.type_;      // Request/Response
data.protocol = result.protocol; // L7 protocol (HTTP, gRPC, etc.)
data.seq = result.seq;          // Sequence for correlation
data.uuid = result.uuid;        // Unique identifier
}
Supported Protocols:
- HTTP/HTTPS
- gRPC
- Redis
- MongoDB
- MySQL
- PostgreSQL
- And more...
Performance Characteristics
Hook Overhead
| Operation | Overhead | Impact |
|---|---|---|
| Process Filtering | 50ns | Per syscall |
| Entry Processing | 200ns | Per syscall |
| Exit Processing | 2-5μs | Per syscall |
| Protocol Inference | 0.5-1μs | Per message |
Optimization Features
- Early Filtering: Skip non-monitored processes immediately
- FD Validation: Skip standard I/O file descriptors
- Type Safety: Rust prevents runtime errors
- Memory Safety: Automatic bounds checking
- Zero-Copy: Efficient data handling where possible
Error Handling
DeepTrace uses comprehensive error handling with specific error codes:
#![allow(unused)]
fn main() {
// From ebpf-common/src/error/code.rs
pub const MAP_INSERT_FAILED: u32 = 1;
pub const MAP_DELETE_FAILED: u32 = 2;
pub const MAP_GET_FAILED: u32 = 3;
pub const INVALID_DIRECTION: u32 = 4;
pub const SYSCALL_PAYLOAD_LENGTH_INVALID: u32 = 5;
}
Next Steps
- Data Structures: Learn about eBPF data structures
- Memory Maps: Understand eBPF map usage
- Performance Analysis: Optimize eBPF performance
Data Structures
DeepTrace's eBPF implementation uses Rust-based data structures built with the Aya framework. These structures efficiently capture, store, and transmit network trace information between eBPF programs and user space.
Structure Design Principles
DeepTrace's data structures are designed with several key principles:
- Type Safety: Leverage Rust's type system for memory safety
- Performance: Optimize for fast access and minimal copying
- Aya Integration: Native integration with Aya framework features
- Cross-Boundary Compatibility: Seamless data sharing between eBPF and user space
- Protocol Awareness: Support for L7 protocol inference and correlation
Core Enumeration Types
Syscall Enum
Identifies the specific system call being monitored:
#![allow(unused)]
fn main() {
#[cfg_attr(feature = "user", derive(serde::Serialize))]
#[repr(u8)]
pub enum Syscall {
    // Ingress operations
    Read,
    ReadV,
    RecvFrom,
    RecvMsg,
    RecvMMsg,

    // Egress operations
    Write,
    WriteV,
    SendTo,
    SendMsg,
    SendMMsg,

    Unknown,
}
}
Usage:
- System call identification in traces
- Performance analysis by syscall type
- Protocol-specific processing logic
- Serialization to JSON for user space
Memory Layout: 1 byte (u8)
Direction Enum
Categorizes system calls by data flow direction:
#![allow(unused)]
fn main() {
#[cfg_attr(feature = "user", derive(serde::Serialize))]
#[derive(Clone, Copy, PartialEq)]
#[repr(u8)]
pub enum Direction {
    Ingress,  // Incoming data (read operations)
    Egress,   // Outgoing data (write operations)
    Unknown,
}
}
Purpose:
- Distinguish request vs response processing
- Enable directional filtering
- Support span correlation algorithms
- Request/response matching
Memory Layout: 1 byte (u8)
Buffer Structure
A compile-time sized buffer for safe data handling:
#![allow(unused)]
fn main() {
// From ebpf-common/src/buffer.rs
#[repr(C)]
#[derive(Clone, Copy)]
pub struct Buffer<const N: usize> {
    buf: [u8; N],
    len: usize,
}
}
Key Features:
- Compile-time Size: Size known at compile time for safety
- Bounds Checking: Automatic bounds checking for all operations
- Zero-Copy: Efficient slice operations without copying
- Generic Size: Can be instantiated with any size
N
Common Instantiations:
#![allow(unused)]
fn main() {
pub type TaskCommBuffer = Buffer<TASK_COMM_LEN>;     // 16 bytes
pub type PayloadBuffer = Buffer<MAX_PAYLOAD_SIZE>;   // 4096 bytes
pub type InferBuffer = Buffer<MAX_INFER_SIZE>;       // Variable size
}
Methods:
#![allow(unused)]
fn main() {
impl<const N: usize> Buffer<N> {
    pub fn new() -> Self;
    pub fn as_slice(&self) -> &[u8];
    pub fn from_slice(slice: &[u8]) -> Self;
    pub fn len(&self) -> usize;
    pub fn read_user_at(&mut self, ptr: *mut u8, size: u32) -> Result<()>;
    pub fn fill_from_iovec<const IOV_MAX: usize>(&mut self, iovec: iovec, vlen: u32, max_size: Option<usize>) -> Result<()>;
    pub fn fill_from_mmsghdr<const IOVLEN_MAX: usize>(&mut self, mmsg: mmsghdr, vlen: u32, max_size: Option<usize>) -> Result<()>;
}
}
Protocol Enumerations
L7Protocol Enum
Identifies Layer 7 application protocols:
#![allow(unused)]
fn main() {
// From observ-trace-common/src/protocols/l7.rs
#[cfg_attr(feature = "user", derive(Eq, Hash, serde::Serialize))]
#[derive(FromPrimitive, IntoPrimitive, PartialEq, Copy, Clone)]
#[repr(u8)]
pub enum L7Protocol {
    #[default]
    Unknown = 0,

    // HTTP
    HTTP1 = 20,
    Http2 = 21,

    // RPC
    Dubbo = 40,
    Grpc = 41,
    SofaRPC = 43,
    FastCGI = 44,
    Brpc = 45,
    Tars = 46,
    SomeIp = 47,
    Thrift = 48,

    // SQL
    MySQL = 60,
    PostgreSQL = 61,
    Oracle = 62,

    // NoSQL
    Redis = 80,
    MongoDB = 81,
    Memcached = 82,
    Cassandra = 83,

    // MQ
    Kafka = 100,
    MQTT = 101,
    AMQP = 102,
    OpenWire = 103,
    NATS = 104,
    Pulsar = 105,
    ZMTP = 106,
    RocketMQ = 107,

    // INFRA
    DNS = 120,
    TLS = 121,
    Ping = 122,

    Custom = 127,
    Max = 255,
}
}
L4Protocol Enum
Identifies Layer 4 transport protocols:
#![allow(unused)]
fn main() {
// From observ-trace-common/src/protocols/l4.rs
#[cfg_attr(feature = "user", derive(serde::Serialize, Hash, Eq))]
#[derive(Clone, Copy, PartialEq)]
#[repr(u16)]
pub enum L4Protocol {
    IPPROTO_IP = 0,      // Dummy protocol for TCP
    IPPROTO_ICMP = 1,    // Internet Control Message Protocol
    IPPROTO_IGMP = 2,    // Internet Group Management Protocol
    IPPROTO_IPIP = 4,    // IPIP tunnels
    IPPROTO_TCP = 6,     // Transmission Control Protocol
    IPPROTO_EGP = 8,     // Exterior Gateway Protocol
    IPPROTO_PUP = 12,    // PUP protocol
    IPPROTO_UDP = 17,    // User Datagram Protocol
    // ... more protocols
    IPPROTO_RAW = 255,   // Raw IP packets
    IPPROTO_MPTCP = 262, // Multipath TCP connection
}
}
Primary Data Structures
Quintuple Structure
The network flow identifier that uniquely identifies a connection:
#![allow(unused)]
fn main() {
#[cfg_attr(feature = "user", derive(serde::Serialize, Hash, Eq, PartialEq))]
#[derive(Clone, Copy)]
#[repr(C)]
pub struct Quintuple {
    pub src_addr: u32,           // Source IP address
    pub dst_addr: u32,           // Destination IP address
    pub src_port: u16,           // Source port
    pub dst_port: u16,           // Destination port
    pub l4_protocol: L4Protocol, // L4 protocol (TCP/UDP)
    #[cfg_attr(feature = "user", serde(skip))]
    padding: u16,                // Alignment padding
}
}
Key Features:
- Unique Flow Identification: Distinguishes different network connections
- Bidirectional Support: Same quintuple for both directions of a flow
- Protocol Awareness: Includes L4 protocol information
- Serialization Support: JSON serialization for user space
- Hash-Friendly: Optimized for use as hash map keys
Memory Layout: 16 bytes total
Constructor:
#![allow(unused)]
fn main() {
impl Quintuple {
    pub fn new(
        src_addr: u32,
        dst_addr: u32,
        src_port: u16,
        dst_port: u16,
        l4_protocol: u16,
    ) -> Quintuple {
        // Implementation handles protocol conversion
    }
}
}
Usage Example:
#![allow(unused)]
fn main() {
// From observ-trace-ebpf/src/utils.rs
#[inline(always)]
pub fn quintuple_from_sock(tcp_sock: tcp_sock) -> Result<Quintuple> {
    let src_addr = core_read_kernel!(tcp_sock, inet_conn, icsk_inet, inet_saddr)?.to_be();
    let sock_common = core_read_kernel!(tcp_sock, inet_conn, icsk_inet, sk, __sk_common)?;
    let dst_addr = sock_common.skc_daddr().ok_or(READ_SKC_DADDR_FAILED)?.to_be();
    let src_port = core_read_kernel!(tcp_sock, inet_conn, icsk_inet, inet_sport)?.to_be();
    let dst_port = sock_common.skc_dport().ok_or(READ_SKC_DPORT_FAILED)?.to_be();
    let skc_family = sock_common.skc_family().ok_or(READ_SKC_FAMILY_FAILED)?;
    Ok(Quintuple::new(src_addr, dst_addr, src_port, dst_port, skc_family))
}
}
Key Features:
- CO-RE Support: Uses
core_read_kernel!macro for safe kernel memory access - Error Handling: Returns
Result<Quintuple>with specific error codes - Byte Order: Converts to big-endian (network byte order) with
.to_be() - Type Safety: Uses Rust's type system and Option types for safety
- Memory Safety: Safe kernel structure field access through CO-RE
Args Structure
Stores system call context during the entry phase:
#![allow(unused)]
fn main() {
#[repr(C)]
pub struct Args {
    pub fd: u64,           // File descriptor
    pub enter_time: u64,   // Entry timestamp (nanoseconds)
    pub buffer: SysBufPtr, // Buffer information
    pub enter_seq: u32,    // TCP sequence number at entry
    pub padding: u32,      // Alignment padding
}
}
Constructors:
#![allow(unused)]
fn main() {
impl Args {
    pub fn from_ubuf(fd: u64, buf: *mut u8, count: u32, timestamp: u64, enter_seq: u32) -> Self;
    pub fn from_msg(fd: u64, vec: iovec, vlen: u32, timestamp: u64, enter_seq: u32) -> Self;
    pub fn from_mmsg(fd: u64, mmsg: mmsghdr, vlen: u32, timestamp: u64, enter_seq: u32) -> Self;
}
}
Buffer Types:
#![allow(unused)]
fn main() {
pub enum SysBufPtr {
    Ubuf(*mut u8, u32),    // User buffer
    Msg(iovec, u32),       // Message vector
    MMsg(mmsghdr, u32),    // Multiple messages
}
}
Lifecycle:
- Created: When system call enters
- Stored: In INGRESS/EGRESS eBPF maps
- Retrieved: When system call exits
- Destroyed: After data extraction
Memory Layout: 32 bytes total
Key Fields:
fd: Links to socket informationseq: Enables TCP sequence trackingtimestamp: Calculates syscall latencybuffer: Handles different buffer types
Message Structure
The complete trace record sent to user space:
#![allow(unused)]
fn main() {
#[cfg_attr(feature = "user", derive(serde::Serialize))]
#[repr(C)]
pub struct Message {
    // Process Information
    pub tgid: u32,                    // Thread Group ID (process ID)
    pub pid: u32,                     // Thread ID

    // Timing Information
    pub enter_seq: u32,               // TCP sequence at entry
    pub exit_seq: u32,                // TCP sequence at exit
    pub timestamp_ns: u64,            // Exit timestamp (nanoseconds)

    // Correlation Information
    #[cfg_attr(feature = "user", serde(skip))]
    pub seq: u32,                     // Sequence for correlation
    #[cfg_attr(feature = "user", serde(skip))]
    pub uuid: u32,                    // Unique identifier for correlation

    // Network Information
    #[cfg_attr(feature = "user", serde(flatten))]
    pub quintuple: Quintuple,         // Network flow identifier

    // System Call Information
    pub syscall: Syscall,             // System call identifier
    pub direction: Direction,         // Ingress/Egress direction

    // Protocol Information
    #[cfg_attr(feature = "user", serde(rename(serialize = "type")))]
    pub type_: MessageType,           // Request/Response type
    pub protocol: L7Protocol,         // L7 protocol (HTTP, gRPC, etc.)

    // Process Information
    #[cfg_attr(feature = "user", serde(serialize_with = "serialize_comm"))]
    pub comm: Buffer<TASK_COMM_LEN>,  // Process name (16 bytes)

    // Payload Data
    #[cfg_attr(feature = "user", serde(serialize_with = "serialize_buffer"))]
    pub payload: Buffer<MAX_PAYLOAD_SIZE>, // Actual network data
}
}
MessageType Enum
Classifies message types for correlation:
#![allow(unused)]
fn main() {
// From observ-trace-common/src/message.rs
#[cfg_attr(feature = "user", derive(serde::Serialize))]
#[derive(Clone, Copy, PartialEq)]
#[repr(u8)]
pub enum MessageType {
    Unknown = 0,
    Request = 1,
    Response = 2,
}
}
SocketInfo Structure
Socket metadata for correlation and protocol inference:
#![allow(unused)]
fn main() {
// From observ-trace-common/src/socket.rs
#[derive(Clone, Copy)]
#[repr(C)]
pub struct SocketInfo {
    pub uuid: u32,
    pub exit_seq: u32,
    pub seq: u32,
    pub direction: Direction,
    pub pre_direction: Direction,
    pub l7protocol: L7Protocol,
    padding: u8,
    pub prev_buf: Buffer<MAX_INFER_SIZE>,
}
}
Key Fields:
- uuid: Unique identifier for correlation
- exit_seq: TCP sequence number at exit
- seq: Current sequence number
- direction: Current data flow direction
- pre_direction: Previous data flow direction
- l7protocol: Detected Layer 7 protocol
- prev_buf: Buffer for protocol inference
Usage:
- Protocol detection and caching
- TCP sequence tracking
- Request/response correlation
- Multi-message protocol handling
Constants and Configuration
Buffer Sizes
#![allow(unused)]
fn main() {
// From observ-trace-common/src/constants.rs
pub const MAX_PID_NUMBERS: u32 = 256;        // Maximum monitored PIDs
pub const MAX_INFER_SIZE: usize = 1024;      // Protocol inference buffer
pub const MAX_PAYLOAD_SIZE: usize = 4096;    // Maximum captured payload
pub const TASK_COMM_LEN: usize = 16;         // Linux task command length
}
Memory Layout Summary
| Structure | Size | Purpose |
|---|---|---|
Syscall | 1 byte | System call identification |
Direction | 1 byte | Data flow direction |
MessageType | 1 byte | Request/Response classification |
L7Protocol | 1 byte | Layer 7 protocol |
L4Protocol | 2 bytes | Layer 4 protocol |
Quintuple | 16 bytes | Network flow identifier |
Args | 32 bytes | System call context |
Message | ~4.2KB | Complete trace record |
SocketInfo | Variable | Socket metadata |
Buffer<N> | N + 8 bytes | Generic buffer |
Type Safety and Validation
Rust Type System Benefits
DeepTrace leverages Rust's type system for safety:
#![allow(unused)]
fn main() {
// Compile-time size validation
const _: () = assert!(core::mem::size_of::<Message>() <= 8192);

// Type-safe protocol handling
impl L7Protocol {
    pub fn is_http(&self) -> bool {
        matches!(self, L7Protocol::HTTP1 | L7Protocol::Http2)
    }

    pub fn is_rpc(&self) -> bool {
        matches!(self, L7Protocol::Grpc | L7Protocol::Dubbo | L7Protocol::Thrift)
    }
}
}
Memory Safety Features
- Bounds Checking: Automatic array bounds checking
- Null Safety: Option types prevent null pointer dereferences
- Lifetime Management: RAII ensures proper cleanup
- Type Safety: Strong typing prevents type confusion
Serialization Support
User space structures support JSON serialization:
#![allow(unused)]
fn main() {
// Automatic JSON serialization
#[cfg_attr(feature = "user", derive(serde::Serialize))]
pub struct Message {
    // Fields with custom serialization
    #[cfg_attr(feature = "user", serde(serialize_with = "serialize_comm"))]
    pub comm: Buffer<TASK_COMM_LEN>,

    // Fields excluded from serialization
    #[cfg_attr(feature = "user", serde(skip))]
    pub uuid: u32,
}
}
Performance Optimizations
Memory Layout
- Cache-Friendly: Hot fields placed first
- Alignment: Proper alignment for optimal access
- Padding: Explicit padding for consistent layout
- Size Optimization: Minimal memory footprint
Zero-Copy Operations
#![allow(unused)]
fn main() {
// Zero-copy slice access
impl<const N: usize> Buffer<N> {
    pub fn as_slice(&self) -> &[u8] {
        &self.buf[..min(self.len(), N)]
    }
}

// Direct encoding without copying
impl Message {
    pub fn encode(&self) -> &[u8] {
        unsafe {
            core::slice::from_raw_parts(
                (self as *const Self) as *const u8,
                core::mem::size_of::<Message>(),
            )
        }
    }
}
}
Next Steps
- System Hooks: Learn about eBPF program implementation
- Memory Maps: Understand eBPF map usage
- Performance Analysis: Optimize eBPF performance
eBPF Maps
eBPF maps are the primary mechanism for sharing data between eBPF programs and user space. DeepTrace uses Aya framework's type-safe map abstractions to efficiently manage trace data, process filtering, and inter-program communication.
Map Architecture Overview
DeepTrace's map architecture uses Aya's HashMap and PerfEventByteArray:
graph TB
    subgraph "User Space"
        AGENT[DeepTrace Agent]
        MANAGER[eBPF Manager]
    end

    subgraph "eBPF Maps (Aya Framework)"
        PIDS[PIDS HashMap<br/>Process Filter]
        INGRESS[INGRESS HashMap<br/>Entry Context]
        EGRESS[EGRESS HashMap<br/>Exit Context]
        EVENTS[EVENTS PerfEventByteArray<br/>Data Transfer]
        SOCKET_INFO[SOCKET_INFO HashMap<br/>Socket Metadata]
    end

    subgraph "eBPF Programs"
        TRACE[observ-trace-ebpf]
        CPU[observ-cpu-ebpf]
        MEMORY[observ-memory-ebpf]
        DISK[observ-disk-ebpf]
    end

    AGENT --> MANAGER
    MANAGER --> PIDS
    MANAGER <--> EVENTS
    TRACE <--> INGRESS
    TRACE <--> EGRESS
    TRACE --> EVENTS
    TRACE <--> SOCKET_INFO
    CPU --> EVENTS
    MEMORY --> EVENTS
    DISK --> EVENTS
Core Maps
1. PIDS Map - Process Filtering
Purpose: Maintains a list of processes to monitor, enabling selective tracing
#![allow(unused)]
fn main() {
use observ_trace_common::constants::MAX_PID_NUMBERS;

/// Filter the trigger of system call hooks by pid generated at user space.
#[map(name = "PIDS")]
pub(crate) static mut PIDS: HashMap<u32, u32> = HashMap::with_max_entries(MAX_PID_NUMBERS, 0);
}
Configuration:
- Type: Aya
HashMap - Max Entries:
MAX_PID_NUMBERS(configurable) - Key: Process ID (u32)
- Value: Monitoring flags (u32)
- Framework: Aya type-safe map abstraction
Usage Pattern:
#![allow(unused)]
fn main() {
// From utils.rs - Actual implementation
#[inline(always)]
pub(crate) fn is_filtered_pid() -> bool {
    let tgid = (bpf_get_current_pid_tgid() >> 32) as u32;
    unsafe { PIDS.get_ptr(&tgid) }.is_some()
}
}
Key Features:
- Simple Lookup: Check if PID exists in map
- O(1) Performance: Hash map provides constant-time lookup
- Type Safety: Rust prevents invalid memory access
- Early Exit: Return immediately if PID not monitored
Management:
- Population: User space agent populates based on configuration
- Updates: Dynamic addition/removal of processes
- Cleanup: Automatic cleanup of terminated processes
2. INGRESS Map - Incoming Call Context
Purpose: Stores system call context for incoming network operations
#![allow(unused)]
fn main() {
use crate::types::Args;

/// Storage params when enter syscalls.
#[map(name = "ingress")]
pub(crate) static mut INGRESS: HashMap<u64, Args> = HashMap::with_max_entries(1 << 10, 0);
}
Configuration:
- Type: Aya
HashMap - Max Entries: 1024 (1 << 10) concurrent operations
- Key: Combined thread group and process ID (u64)
- Value:
Argsstructure with call context - Framework: Type-safe Rust implementation
Key Generation:
#![allow(unused)]
fn main() {
// From process.rs - Actual implementation
let id = bpf_get_current_pid_tgid();  // Returns u64: (tgid << 32) | pid
}
Key Format:
- Upper 32 bits: Thread Group ID (TGID/Process ID)
- Lower 32 bits: Thread ID (TID)
- Uniqueness: Each thread has a unique key
Lifecycle:
- Entry: Store context when syscall enters
- Processing: Kernel processes the system call
- Exit: Retrieve context and extract data
- Cleanup: Remove entry after processing
Collision Handling:
- Uses thread-specific keys to avoid collisions
- Automatic cleanup prevents map overflow
- LRU eviction for memory management
3. EGRESS Map - Outgoing Call Context
Purpose: Stores system call context for outgoing network operations
#![allow(unused)]
fn main() {
/// Storage params when enter syscalls.
#[map(name = "egress")]
pub(crate) static mut EGRESS: HashMap<u64, Args> = HashMap::with_max_entries(1 << 10, 0);
}
Configuration: Identical to INGRESS map
- Type: Aya
HashMap - Max Entries: 1024 concurrent operations
- Key: Combined thread group and process ID (u64)
- Value:
Argsstructure with call context
Usage: Same pattern as INGRESS but for outbound operations
Separation Rationale:
- Performance: Reduces lock contention
- Clarity: Clear separation of data flow directions
- Scalability: Independent sizing based on workload patterns
4. EVENTS PerfEventByteArray - Data Transfer
Purpose: High-performance data transfer from kernel to user space
#![allow(unused)]
fn main() {
#[map(name = "EVENTS")]
pub(crate) static mut EVENTS: PerfEventByteArray = PerfEventByteArray::new(0);
}
Configuration:
- Type: Aya
PerfEventByteArray - Size: Configurable via user space
- Ordering: FIFO ordering guarantees
- Blocking: Non-blocking writes with overflow handling
- Framework: Aya's type-safe perf event abstraction
Usage Pattern:
#![allow(unused)]
fn main() {
// In eBPF program (process.rs)
unsafe { EVENTS.output(ctx, data.encode(), 0) };
}
Message Encoding:
#![allow(unused)]
fn main() {
impl Message {
    #[inline]
    pub fn encode(&self) -> &[u8] {
        unsafe {
            core::slice::from_raw_parts(
                (self as *const Self) as *const u8,
                core::mem::size_of::<Message>(),
            )
        }
    }
}
}
Performance Characteristics:
- Latency: Sub-microsecond data transfer
- Throughput: >1M events/second
- Memory: Lock-free single-producer, single-consumer
- Ordering: Maintains temporal ordering of events
5. SOCKET_INFO Map - Socket Metadata
Purpose: Stores socket-specific information for correlation and protocol inference
#![allow(unused)]
fn main() {
// Defined in observ-trace-common/src/maps.rs
use crate::socket::SocketInfo;

#[map(name = "SOCKET_INFO")]
pub static mut SOCKET_INFO: HashMap<u64, SocketInfo> = HashMap::with_max_entries(1 << 16, 0);
}
Configuration:
- Type: Aya
HashMap - Max Entries: 65536 (1 << 16) socket connections
- Key: Connection key (generated from PID and FD)
- Value:
SocketInfostructure with socket metadata
Key Generation:
#![allow(unused)] fn main() { // From utils.rs - Actual implementation #[inline(always)] pub(crate) fn gen_connect_key(high: u64, low: u64) -> u64 { (high & 0xFFFFFFFF00000000) | (low & 0x00000000FFFFFFFF) } }
Key Format:
- Upper 32 bits: Process ID (from
bpf_get_current_pid_tgid()) - Lower 32 bits: File descriptor
- Uniqueness: Each socket connection has a unique key
SocketInfo Structure:
#![allow(unused)] fn main() { pub struct SocketInfo { pub uuid: u32, pub exit_seq: u32, pub seq: u32, pub direction: Direction, pub pre_direction: Direction, pub l7protocol: L7Protocol, pub prev_buf: Buffer<MAX_INFER_SIZE>, } }
Memory Management
eBPF-Safe Memory Allocation
DeepTrace uses a custom allocator from ebpf-common for safe memory management:
#![allow(unused)] fn main() { use ebpf_common::alloc; // Initialize allocator alloc::init()?; // Allocate zero-initialized memory let data = alloc::alloc_zero::<Message>()?; let buffer = alloc::alloc_zero::<Buffer<MAX_INFER_SIZE>>()?; }
Memory Safety Features
- Type Safety: Rust's ownership system prevents memory errors
- Bounds Checking: Automatic bounds checking for buffer operations
- Zero-Copy Operations: Minimize memory copying where possible
- Automatic Cleanup: RAII ensures proper resource cleanup
Buffer Management
DeepTrace uses the Buffer type from ebpf-common for safe data handling:
#![allow(unused)] fn main() { use ebpf_common::buffer::Buffer; // Create buffer with compile-time size checking let mut payload_buffer = Buffer::<MAX_PAYLOAD_SIZE>::new(); // Safe data extraction args.extract(&mut payload_buffer, ret_size)?; // Access buffer data safely let data_slice = payload_buffer.as_slice(); }
Error Handling
Comprehensive error handling with specific error codes:
#![allow(unused)] fn main() { use ebpf_common::error::{Result, code::*}; pub const MAP_INSERT_FAILED: u32 = 1; pub const MAP_DELETE_FAILED: u32 = 2; pub const MAP_GET_FAILED: u32 = 3; pub const INVALID_DIRECTION: u32 = 4; pub const SYSCALL_PAYLOAD_LENGTH_INVALID: u32 = 5; }
Performance Characteristics
Map Performance Metrics
| Map Type | Operations/sec | Latency (avg) | Memory Usage |
|---|---|---|---|
| PIDS HashMap | 10K lookups/sec | 50ns | ~4KB |
| INGRESS/EGRESS HashMap | 1M ops/sec | 100ns | ~64KB each |
| EVENTS PerfEventByteArray | 1M events/sec | 200ns | Configurable |
| SOCKET_INFO HashMap | 500K ops/sec | 150ns | ~4MB |
Optimization Features
- Type Safety: Compile-time guarantees prevent runtime errors
- Zero-Copy: Efficient data transfer without unnecessary copying
- Batch Processing: Efficient bulk operations where possible
- Memory Pooling: Custom allocator reduces allocation overhead
Development and Debugging
Map Inspection
# List all loaded eBPF maps
bpftool map list
# Dump map contents
bpftool map dump name PIDS
# Monitor map statistics
bpftool map show name EVENTS
Debugging Tools
- aya-log: Structured logging from eBPF programs
- bpftool: Map inspection and debugging
- Custom debug counters: Runtime statistics collection
Best Practices
Map Design
- Size Appropriately: Choose map sizes based on expected workload
- Use Type Safety: Leverage Rust's type system for correctness
- Handle Errors: Always check map operation results
- Clean Up: Remove stale entries to prevent map overflow
Performance Optimization
- Minimize Map Operations: Reduce frequency of map lookups
- Use Efficient Keys: Choose keys that distribute evenly
- Batch Operations: Group related operations when possible
- Monitor Usage: Track map utilization and performance
Troubleshooting Common Issues
Map Overflow
Problem: Maps reaching maximum capacity
Detection:
# Check map usage
bpftool map list
bpftool map dump name INGRESS | wc -l
Solutions:
- Increase map size limits in configuration
- Implement more aggressive cleanup
- Add backpressure mechanisms
Memory Pressure
Problem: High memory usage from maps
Monitoring:
# Monitor memory usage
cat /proc/meminfo | grep -E "(MemAvailable|Buffers)"
bpftool map show | grep -E "(bytes|entries)"
Mitigation:
- Optimize data structures
- Implement LRU eviction
- Use more efficient map types
Next Steps
- System Hooks: Learn about eBPF program implementation
- Data Structures: Understand data structure design
- Performance Analysis: Optimize eBPF performance
Span Correlation Algorithms
Transaction Inference
Custom Protocol Support
Performance Tuning
Monitoring & Observability
Testing Guide
This comprehensive testing guide covers all aspects of testing DeepTrace and Prism, from unit tests to end-to-end integration testing. Proper testing ensures reliability, performance, and correctness of the distributed tracing system.
Testing Components
DeepTrace includes several testable components:
- DeepTrace Agent: Core eBPF-based data collection
- Prism Agent: Lightweight observability agent
- Server Components: Data processing and storage
- Protocol Inference: Automatic protocol detection
- Span Construction: Distributed trace correlation
Testing Philosophy
DeepTrace's testing strategy is built on several key principles:
1. Multi-Layer Testing
- Unit Tests: Individual component functionality
- Integration Tests: Component interaction testing
- System Tests: End-to-end workflow validation
- Performance Tests: Scalability and overhead measurement
2. Realistic Test Environments
- Production-Like Setup: Mirror production configurations
- Real Workloads: Use actual microservices applications
- Network Conditions: Test under various network scenarios
- Load Patterns: Validate under different traffic patterns
3. Automated Testing
- Continuous Integration: Automated test execution
- Regression Testing: Prevent functionality breakage
- Performance Regression: Monitor performance changes
- Compatibility Testing: Ensure cross-platform compatibility
Test Environment Setup
1. Development Environment
Prerequisites
# Install testing dependencies
sudo apt-get install -y \
docker.io \
python3 \
python3-pip \
curl
# Install Python packages for testing
pip3 install requests elasticsearch pymongo redis python-binary-memcached
Test Infrastructure
# Clone repository
git clone https://github.com/DeepShield-AI/DeepTrace.git
cd DeepTrace
# No additional setup required - use provided deployment scripts
2. Test Data Generation
Sample Applications
# Deploy test microservices
cd tests/workload/bookinfo
sudo bash deploy.sh
# Deploy social network application
cd tests/workload/socialnetwork
bash deploy.sh
# Generate test traffic
cd tests/workload/bookinfo
sudo bash client.sh
Unit Testing
1. eBPF Program Testing
Running eBPF Tests
# Run basic functionality tests
cd tests/eBPF/functionality
python3 server.py &
python3 client.py
# Run overhead tests
cd tests/eBPF/overhead
bash run.sh write
2. Agent Testing
Agent testing is performed through integration tests using actual workload applications.
3. Server Testing
Server component testing includes correlation algorithm validation using real trace data from workload applications.
Integration Testing
Integration tests use real workload applications (BookInfo, Social Network) to verify end-to-end tracing functionality.
Test Workflow
- Deploy workload applications using provided scripts
- Start DeepTrace agent with monitoring
- Generate traffic using client scripts
- Verify trace data in Elasticsearch
- Cleanup test environment
Performance Testing
Performance testing measures system call overhead using the scripts in tests/eBPF/overhead/.
System Testing
System testing validates DeepTrace deployment and operation in production-like environments using the provided workload applications.
Test Environment Cleanup
Cleanup test environments using the provided cleanup scripts:
# Cleanup BookInfo workload
cd tests/workload/bookinfo
sudo bash clear.sh
# Cleanup Social Network workload
cd tests/workload/socialnetwork
bash clear.sh
Prism Testing Guide
Prism includes a comprehensive testing framework designed to ensure reliability, accuracy, and performance of the metric collection system. The testing infrastructure consists of multiple layers, from unit tests for individual components to sophisticated integration tests that validate end-to-end functionality.
Testing Philosophy
Our testing approach is built on several key principles:
Accuracy First
Every metric collected by Prism must be accurate and verifiable. Our tests generate known data and verify that the parsing and processing logic produces exactly the expected results.
Comprehensive Coverage
Testing covers all metric collection modules, data processing pipelines, and output formats to ensure no component is left unvalidated.
Test Categories
Unit Tests
Individual component testing for core functionality:
- Metric parsing logic
- Data structure operations
- Configuration management
Integration Tests
End-to-end testing with realistic system data:
- Complete metric collection workflows
- Multi-module interaction testing
- Output format validation
Running Tests
Quick Test Run
cd agent
# Run all tests
cargo test
# Run tests with output
cargo test -- --nocapture
# Run specific test module
cargo test -p observ-cpu
Comprehensive Testing
# Run integration tests
cargo run --bin procfs_integration_tests -- --count 10 --verbose
# Run with custom configuration
cargo run --bin procfs_integration_tests -- --count 5 --output test-results
Integration Tests
Prism's integration testing framework is a sophisticated system designed to validate the complete metric collection pipeline from data generation to final output. The integration tests ensure that all components work together correctly and that the system produces accurate results under various conditions.
Overview
The integration testing framework, located in tests/procfs-integration-tests/, provides comprehensive end-to-end validation of Prism's metric collection capabilities. It generates realistic procfs data, processes it through Prism's collection modules, and validates that the results match expected values with perfect accuracy.
Architecture
Test Framework Components
Integration Test Framework
├── Data Generation
│ ├── Random procfs file generation
│ └── Realistic system resource simulation
├── Metric Collection
│ ├── Prism module invocation
│ ├── Environment isolation
│ └── Process separation
└── Validation
├── Field-by-field verification
├── Unit conversion validation
└── Performance measurement
Key Features
- Random Data Generation: Creates realistic but controlled test data
- Process Isolation: Each test runs in a separate process to avoid conflicts
- Comprehensive Validation: Verifies every collected metric field
- Performance Monitoring: Tracks collection performance and overhead
Test Data Generation
Supported Metrics
The framework generates test data for all major system metrics:
CPU Metrics (/proc/stat)
- Random CPU core count (1-16 cores)
- Context switch statistics
- Process and thread counts
- Boot time and system uptime
Memory Metrics (/proc/meminfo)
- Total memory size
- Realistic memory usage patterns
- Cache and buffer allocations
- Swap space configuration
- Active/inactive memory distribution
Virtual Memory Statistics (/proc/vmstat)
- Page allocation and deallocation statistics
- Memory pressure indicators
- NUMA topology statistics
- I/O and swap activity metrics
- Slab cache utilization
Disk Metrics (/proc/diskstats)
- Multiple device types (SATA, NVMe, loop devices)
- Read/write operation statistics
- I/O timing and queue depth metrics
- Sector-level transfer statistics
Network Metrics (/proc/net/dev)
- Traffic statistics (bytes, packets)
- Error and drop counters
- Realistic usage patterns
Test Execution
Command Line Interface
The integration test framework provides a modern command-line interface:
# Basic usage
cargo run --bin procfs_integration_tests
# Multiple test runs
cargo run --bin procfs_integration_tests -- --count 5
# Verbose output with detailed validation
cargo run --bin procfs_integration_tests -- --count 3 --verbose
# Custom output directory
cargo run --bin procfs_integration_tests -- --output custom-results
# Show help and version information
cargo run --bin procfs_integration_tests --help
cargo run --bin procfs_integration_tests --version
Test Process
Each integration test follows this workflow:
-
Environment Preparation
- Create isolated test directory
- Generate random procfs data
- Set environment variables for procfs root
-
Metric Collection
- Initialize Prism metric collection modules
- Invoke collection functions (e.g.,
prism_cpu::stat()) - Capture all collected metrics
-
Validation
- Compare collected values with generated expected values
- Verify unit conversions and data transformations
- Check field completeness and accuracy
-
Result Recording
- Generate detailed validation reports
- Record performance metrics
Test Output and Reporting
Directory Structure
Each test run creates a timestamped session directory:
output/20250920-183856/
├── test-001/
│ ├── procfs/ # Generated procfs files
│ │ ├── stat
│ │ ├── meminfo
│ │ ├── vmstat
│ │ ├── diskstats
│ │ └── net/dev
├── test-002/
└── test-003/
Console Output
The test framework provides comprehensive console output:
Starting Prism ProcFS Random Integration Tests
==================================================
Running 3 tests
Test session directory: output/20250922-142804/
Running test 1/3
Test directory: output/20250922-142804/test-001/
Running prism collectors and validating results
Validating CPU metrics
CPU field validation successful
Validating Memory metrics
Memory field validation successful
Validating VmStat metrics
VmStat field validation successful
Validating Disk metrics
Disk field validation successful
Validating Network metrics
Network field validation successful
Test #1 validation completed successfully
✅ Test #1 passed
Test session completed!
Results: 3 passed, 0 failed
All test results saved in: output/20250922-142804/
Unit Tests
Unit tests form the foundation of Prism's testing strategy, providing focused validation of individual components, functions, and modules. These tests ensure that each piece of functionality works correctly in isolation before being integrated into the larger system.
Testing Strategy
Component Isolation
Unit tests focus on testing individual components in isolation:
- Pure Functions: Test mathematical calculations and data transformations
- Data Structures: Validate custom data types and their operations
- Parsing Logic: Verify correct interpretation of procfs file formats
Test Coverage Goals
- Functionality Coverage: Every public function and method
- Branch Coverage: All conditional logic paths
Test Organization
Module Structure
Unit tests are organized alongside the code they test:
crates/
├── prism-cpu/
│ ├── src/
│ │ ├── lib.rs
│ │ ├── stat.rs
│ │ └── ...
│ └── tests/
|
├── prism-memory/
│ ├── src/
│ └── tests/
└── ...
Running Unit Tests
Basic Test Execution
# Run all unit tests
cargo test --release
# Run tests for specific crate
cargo test -p prism-cpu
# Run tests with output
cargo test -- --nocapture
Advanced Test Options
# Run tests in release mode (for performance testing)
cargo test --release
# Run tests with specific number of threads
cargo test --release -- --test-threads=1
# Run ignored tests
cargo test --release -- --ignored
Test Coverage
# Install coverage tool
cargo install cargo-tarpaulin
# Generate coverage report
cargo tarpaulin --out Html
# Coverage for specific crate
cargo tarpaulin -p prism-cpu --out Html
Extending Integration Tests
Adding New Metrics
To add support for new metric types:
- Generator Extension: Add data generation logic in
generators.rs - Validator Implementation: Create validation logic in
validators.rs - Test Integration: Update main test loop to include new metrics
- Documentation: Update test documentation and examples
Configuration Options
Integration tests support various configuration options:
- Test Count: Number of test iterations to run
- Output Directory: Custom location for test results
- Verbosity Level: Control amount of output detail
This comprehensive testing approach ensures Prism's reliability, accuracy, and performance across all deployment scenarios.
Functional Testing Guide
This guide provides comprehensive instructions for testing DeepTrace's core functionality, including eBPF data collection, protocol inference, and span construction.
Overview
DeepTrace functional testing covers several key areas:
- eBPF Functionality: Testing kernel-level data collection
- Protocol Inference: Validating automatic protocol detection
- Span Construction: Testing distributed trace span creation
- Performance Overhead: Measuring system impact
eBPF Functionality Testing
Test Environment Setup
The eBPF functionality tests validate DeepTrace's ability to collect network data at the kernel level.
Prerequisites
- Root privileges (for eBPF program loading)
- Python 3.6+ with required packages
- Network connectivity for test traffic generation
Test Execution
cd DeepTrace/tests/eBPF/functionality
# Start test server in background
python3 server.py &
SERVER_PID=$! # Capture background process PID
# modify deeptrace.toml to include PID monitoring
vim agent/config/deeptrace.toml
# add pids = [SERVER_PID] to the ebpf section
# In another terminal, run the client to send requests
cd DeepTrace/tests/eBPF/functionality
python3 client.py
# Cleanup test server
kill $SERVER_PID
Expected Output Format
The output file contains structured records (location may vary based on configuration):
1201353, RecvFrom, python3, skc_family: IP protocol family, saddr: 127.0.0.1, daddr: 127.0.0.1, sport: 8080, dport: 1814, 707083292245311, 2953620009, 2953620073, 64, [71, 69, 84, 32, 47, 32, 72, 84, 84, 80, 47, 49, 46, 49, 13, 10, 72, 111, 115, 116, 58, 32, 49, 50, 55, 46, 48, 46, 48, 46, 49, 58, 56, 48, 56, 48, 13, 10, 67, 111, 110, 110, 101, 99, 116, 105, 111, 110, 58, 32, 107, 101, 101, 112, 45, 97, 108, 105, 118, 101, 13, 10, 13, 10]
Field Breakdown
- TGID: Thread Group ID (Process ID)
- Syscall: System call name (e.g., RecvFrom)
- Process: Process name
- Protocol Family: Network protocol (IPv4/IPv6)
- Source Address: Connection source IP
- Destination Address: Connection target IP
- Source Port: Connection source port
- Destination Port: Connection target port
- Timestamp: Nanosecond-precision event timestamp
- TCP Sequence Start: Initial TCP sequence number
- TCP Sequence End: Final TCP sequence number
- Payload Length: Message size in bytes
- Payload Buffer: Raw message bytes (ASCII decimal values)
Validation Steps
- Data Completeness: Verify all expected fields are present
- Timestamp Accuracy: Check timestamp ordering and precision
- Payload Integrity: Validate payload data matches expected content
- Process Tracking: Confirm correct PID association
Protocol Inference Testing
Supported Protocols
DeepTrace currently supports automatic inference for:
- MongoDB: Document database protocol
- Redis: Key-value store protocol
- Memcached: Distributed memory caching protocol
Test Setup
Deploy Workload Server
You can deploy test servers using Docker or custom Python scripts:
# Using Docker (recommended)
docker run -d --name redis-test -p 6379:6379 redis:6.2.4
docker run -d --name mongo-test -p 27017:27017 mongo:5.0.15
docker run -d --name memcached-test -p 11211:11211 memcached:1.6.7
Obtain Container Process PID
# Retrieve container ID
docker ps
# Get PID based on container runtime
docker inspect <container-id> -f "{{.State.Pid}}"
Test Execution
Start eBPF Monitoring
In one terminal:
cd agent
RUST_LOG=info cargo xtask build --profile release -c config/deeptrace.toml
Generate Workload Traffic
In another terminal:
# For Redis
cd tests/workload/redis
python3 client.py
# For MongoDB
cd tests/workload/mongodb
python3 client.py
# For Memcached
cd tests/workload/memcached
python3 client.py
Terminate and Analyze
- Terminate the eBPF program after ~5 seconds of traffic generation
- Spans will be sent directly to Elasticsearch based on your configuration
Result Validation
Validate protocol detection by querying Elasticsearch:
# Query spans by protocol
curl -X GET "http://localhost:9200/spans_*/_search" \
-H 'Content-Type: application/json' \
-d '{
"query": {
"term": {
"protocol": "Redis"
}
},
"size": 10
}'
# Aggregate by protocol
curl -X GET "http://localhost:9200/spans_*/_search" \
-H 'Content-Type: application/json' \
-d '{
"size": 0,
"aggs": {
"protocols": {
"terms": {
"field": "protocol"
}
}
}
}'
Or use Kibana:
- Navigate to
http://localhost:5601 - Go to Discover
- Filter by protocol field
- Verify correct protocol detection
Span Construction Testing
Span construction testing validates DeepTrace's ability to correlate network transactions into distributed trace spans.
Test Environment Setup
Start Workload Services
# Deploy using provided docker-compose file
cd deployment/docker
docker-compose -f Workload.yaml up -d
# Verify services are running
docker ps
Expected output shows Redis, MongoDB, and Memcached containers running.
Initialize DeepTrace Agent
# Start the agent
cd agent
RUST_LOG=info cargo xtask run --release -c config/deeptrace.toml
Test Execution
Generate Test Spans
cd tests/workload
# Setup Python environment (if not already done)
python3 -m venv env
source env/bin/activate
pip install redis python-binary-memcached pymongo
# Generate synthetic workload patterns
python3 prepare_spans.py
Expected output:
redis workload completed successfully.
memcached workload completed successfully.
Stop Collection
Use Ctrl+C to stop the DeepTrace agent:
- Spans are automatically sent to Elasticsearch
- eBPF programs are unloaded
- Resources are cleaned up
Span Validation
cd tests/workload
python3 test_span_construct.py
Expected output:
Protocol: Redis
Total: 1000
Correct: 1000
Accuracy: 1.0
Protocol: Memcached
Total: 1000
Correct: 1000
Accuracy: 1.0
No spans found for HTTP1 protocol.
Span Quality Metrics
The validation script checks:
- Request-Response Correlation: Matching requests with responses
- Timing Accuracy: Span duration calculations
- Metadata Completeness: Protocol-specific span attributes
- Trace Continuity: Parent-child span relationships
Performance Overhead Testing
System Impact Measurement
Inject eBPF Program
cd agent
# Configure deeptrace.toml with appropriate settings
RUST_LOG=info cargo xtask run --release -c config/deeptrace.toml
Measure Syscall Overhead
cd tests/eBPF/overhead
bash run.sh <syscall>
Supported syscalls:
write|read|sendto|recvfromsendmsg|sendmmsg|recvmsg|recvmmsgwritev|readv|ssl_write|ssl_readssl|empty
Test Methodology
The overhead test:
- Repeatedly calls a syscall 10^5 times
- Takes the average of 100 iterations
- Compares performance with and without eBPF
Expected Results
Typical overhead measurements:
Syscall: sendto
Without eBPF: 1.2μs average
With eBPF: 1.4μs average
Overhead: 16.7%
Note: For bidirectional syscalls (recvfrom, sendto, recvmsg, sendmsg, recvmmsg, sendmmsg), you need to call both sending and receiving syscalls together.
Troubleshooting Test Issues
Common Problems
-
Permission Denied (eBPF):
sudo setcap cap_sys_admin,cap_bpf+ep target/release/deeptrace -
Missing Dependencies:
# Install required packages sudo apt-get install linux-headers-$(uname -r) pip install -r tests/requirements.txt -
Port Conflicts:
# Check port usage netstat -tulpn | grep :8080 # Kill conflicting processes sudo fuser -k 8080/tcp
Performance Testing Guide
This guide provides comprehensive instructions for testing DeepTrace's performance characteristics, including overhead measurements, throughput analysis, and scalability testing.
Overview
DeepTrace performance testing focuses on several key areas:
- System Overhead: Impact on system performance
- Data Processing Throughput: Rate of data collection and processing
- Memory Usage: Memory consumption patterns
- Scalability: Performance under increasing load
- Resource Utilization: CPU, memory, and network usage
System Overhead Testing
eBPF Program Overhead
The eBPF overhead testing measures the performance impact of DeepTrace's kernel-level monitoring.
Test Setup
cd agent
# Configure the agent (deeptrace.toml already exists)
# Edit config/deeptrace.toml as needed
# Start DeepTrace with eBPF monitoring
RUST_LOG=info cargo xtask run --release -c config/deeptrace.toml
Syscall Overhead Measurement
cd tests/eBPF/overhead
# Run overhead test for specific syscall
bash run.sh <syscall>
Supported syscall tests:
- Basic I/O:
write,read,writev,readv - Network:
sendto,recvfrom,sendmsg,recvmsg - Batch Operations:
sendmmsg,recvmmsg - SSL/TLS:
ssl_write,ssl_read,ssl - Baseline:
empty(no-op for baseline measurement)
Test Methodology
The overhead test performs:
- Baseline Measurement: 10^5 syscall iterations without eBPF
- eBPF Measurement: 10^5 syscall iterations with eBPF active
- Statistical Analysis: Average of 100 test runs
- Overhead Calculation: Percentage increase in execution time
Application-Level Overhead
Test DeepTrace's impact using the provided workload applications:
# Deploy BookInfo application
cd tests/workload/bookinfo
sudo bash deploy.sh
# Start DeepTrace with monitoring
cd agent
RUST_LOG=info cargo xtask run --release -c config/deeptrace.toml
# Generate traffic and observe performance
cd tests/workload/bookinfo
sudo bash client.sh
Performance Analysis
Analyze DeepTrace performance by:
- Comparing application metrics before and after enabling monitoring
- Querying Elasticsearch for trace collection rates
- Monitoring system resources (CPU, memory) during operation
Resource Monitoring
Monitor resource usage during testing:
# Monitor system resources
top -p $(pgrep deeptrace)
htop
# Check memory usage
free -h
# Monitor network I/O
iftop
Scalability Testing
Test scalability using Social Network workload which includes multiple interconnected services:
# Deploy complex multi-service application
cd tests/workload/socialnetwork
bash deploy.sh
bash client.sh
Performance Benchmarking
Benchmark performance using the overhead testing scripts:
cd tests/eBPF/overhead
bash run.sh write
bash run.sh read
bash run.sh sendto
bash run.sh recvfrom
Performance Optimization
Optimize DeepTrace configuration for better performance:
# Adjust configuration in agent/config/deeptrace.toml
[trace.span]
cleanup_interval = 60
max_sockets = 10000
[ebpf.trace]
max_buffered_events = 256
[sender.elastic.trace]
bulk_size = 64
Best Practices
- Run overhead tests on target deployment hardware
- Test with realistic workload applications
- Monitor system resources during testing
- Compare baseline vs monitored performance metrics
- Document configuration changes and their impact
eBPF Testing
DeepTrace's eBPF implementation requires comprehensive testing to ensure accurate data collection, minimal performance overhead, and compatibility across different kernel versions. This document covers the testing strategies, tools, and procedures for validating eBPF functionality.
Overview
eBPF testing in DeepTrace focuses on:
- Functionality Verification: Ensuring accurate data capture from system calls
- Performance Overhead: Measuring impact on application performance
- Kernel Compatibility: Testing across different kernel versions
- Data Integrity: Validating captured trace data accuracy
- Security: Ensuring eBPF programs don't compromise system security
Test Architecture
graph TB
subgraph "eBPF Test Framework"
TH[Test Harness]
SG[Synthetic Generator]
VM[Validation Module]
PM[Performance Monitor]
end
subgraph "Target System"
APP[Test Application]
KERN[Linux Kernel]
EBPF[eBPF Programs]
end
subgraph "Data Collection"
MAPS[eBPF Maps]
RB[Ring Buffers]
PERF[Perf Events]
end
TH --> SG
SG --> APP
APP --> KERN
KERN --> EBPF
EBPF --> MAPS
EBPF --> RB
EBPF --> PERF
VM --> MAPS
PM --> KERN
TH --> VM
TH --> PM
Functionality Tests
System Call Interception
Tests verify that eBPF programs correctly intercept and process system calls:
Network System Calls
cd tests/eBPF/functionality
python3 server.py &
python3 client.py
Tested System Calls:
read()/write()- Socket I/O operationssendmsg()/recvmsg()- Message-based communicationsendmmsg()/recvmmsg()- Batch message operationssendto()/recvfrom()- UDP communicationreadv()/writev()- Vectored I/O operations
Data Validation
Data validation is performed by analyzing the collected trace data in Elasticsearch for correctness and completeness.
Performance Overhead Tests
Micro-benchmarks
Individual system call overhead measurement:
cd tests/eBPF/overhead
./run.sh write # Test write() overhead
./run.sh read # Test read() overhead
./run.sh sendmsg # Test sendmsg() overhead
Test Programs:
-
Write Test (
src/write.c):// Measures write() system call overhead for (int i = 0; i < iterations; i++) { start = get_timestamp(); write(fd, buffer, size); end = get_timestamp(); record_latency(end - start); } -
SSL Test (
src/ssl_write.c):// Measures SSL_write() overhead for (int i = 0; i < iterations; i++) { start = get_timestamp(); SSL_write(ssl, buffer, size); end = get_timestamp(); record_latency(end - start); }
Application-Level Testing
Application-level performance testing uses the provided workload applications (BookInfo, Social Network) to measure real-world impact.
Performance Metrics
Latency Overhead:
- Target: < 5% increase in system call latency
- Measurement: Nanosecond precision timing
- Statistical analysis: Mean, median, 95th/99th percentiles
CPU Overhead:
- Target: < 2% additional CPU usage
- Measurement: CPU utilization monitoring
- Analysis: Per-core usage and context switches
Memory Overhead:
- Target: < 10MB per eBPF program
- Measurement: Map memory usage and kernel memory
- Analysis: Memory growth over time
Kernel Compatibility
DeepTrace requires Linux kernel 5.15+ for proper eBPF functionality. CO-RE (Compile Once, Run Everywhere) support is implemented for kernel compatibility.
Data Integrity
Data integrity is validated by analyzing trace data collected in Elasticsearch, verifying:
- Correct span correlation
- Accurate payload capture
- Proper timestamp recording
Security Considerations
eBPF programs in DeepTrace:
- Run with appropriate privileges
- Include proper memory access bounds checking
- Comply with eBPF verifier constraints
- Respect kernel resource limits
Test Execution
Run eBPF tests using the provided scripts:
# Functionality tests
cd tests/eBPF/functionality
python3 server.py &
python3 client.py
# Performance overhead tests
cd tests/eBPF/overhead
bash run.sh write
bash run.sh read
bash run.sh sendto
Debugging eBPF Programs
Debug Tools
bpftool: Inspect loaded programs and maps
# List loaded programs
bpftool prog list
# Dump program instructions
bpftool prog dump xlated id 123
# Inspect map contents
bpftool map dump id 456
bpftrace: Dynamic tracing for debugging
# Trace eBPF program execution
bpftrace -e 'tracepoint:syscalls:sys_enter_read { @[comm] = count(); }'
Verification Logs
Enable eBPF verifier logs for debugging:
# Enable verbose verifier output
echo 1 > /proc/sys/net/core/bpf_jit_enable
echo 2 > /proc/sys/kernel/bpf_stats_enabled
# Load program with debug info
./load_ebpf_program --debug --log-level 2
Common Issues
-
Verifier Rejection
# Check verifier logs dmesg | grep -i bpf # Common causes: unbounded loops, invalid memory access -
Map Access Errors
# Validate map definitions bpftool map show # Check key/value sizes and types -
Stack Overflow
# Monitor stack usage bpftrace -e 'kprobe:bpf_prog_run { @stack[kstack] = count(); }'
Testing Best Practices
- Run tests in isolated environments
- Use actual workload applications for realistic testing
- Measure performance overhead with provided scripts
- Verify data correctness through Elasticsearch queries
Development Setup
This guide provides comprehensive instructions for setting up a development environment for DeepTrace, including all necessary tools, dependencies, and configurations for building, testing, and debugging the system.
Prerequisites
System Requirements
Operating System:
- Ubuntu 22.04 LTS or later (recommended)
- Linux kernel 5.15+ (kernel 6.8+ strongly recommended)
- x86_64 architecture
Hardware Requirements:
- Minimum: 4 CPU cores, 8GB RAM, 20GB disk space
- Recommended: 8+ CPU cores, 16GB+ RAM, 50GB+ disk space
- SSD storage recommended for better performance
Required Packages
# Update system packages
sudo apt update && sudo apt upgrade -y
# Install essential development tools
sudo apt install -y \
build-essential \
git \
curl \
wget \
pkg-config \
libssl-dev \
libz-dev \
linux-headers-$(uname -r) \
clang \
llvm \
libbpf-dev \
bpftool
# Install additional dependencies
sudo apt install -y \
cmake \
ninja-build \
python3 \
python3-pip \
docker.io \
docker-compose \
jq \
htop \
tree
Rust Development Environment
Rust Installation
# Install Rust using rustup
curl --proto '=https' --tlsv1.2 -sSf https://sh.rustup.rs | sh
source ~/.cargo/env
# Install required Rust components
rustup component add rustfmt clippy
rustup target add x86_64-unknown-linux-musl
# Install cargo extensions
cargo install cargo-watch cargo-edit cargo-audit
Rust Configuration
Create ~/.cargo/config.toml:
[build]
target-dir = "/tmp/cargo-target"
[target.x86_64-unknown-linux-gnu]
rustflags = ["-C", "link-arg=-fuse-ld=lld"]
[registries.crates-io]
protocol = "sparse"
[net]
retry = 2
git-fetch-with-cli = true
eBPF Development Environment
LLVM and Clang Setup
# Install specific LLVM version for eBPF
wget https://apt.llvm.org/llvm.sh
chmod +x llvm.sh
sudo ./llvm.sh 15
# Set up alternatives
sudo update-alternatives --install /usr/bin/clang clang /usr/bin/clang-15 100
sudo update-alternatives --install /usr/bin/llc llc /usr/bin/llc-15 100
sudo update-alternatives --install /usr/bin/opt opt /usr/bin/opt-15 100
# Verify installation
clang --version
llc --version
libbpf Installation
# Clone and build libbpf
git clone https://github.com/libbpf/libbpf.git
cd libbpf/src
make
sudo make install
# Update library path
echo '/usr/local/lib64' | sudo tee -a /etc/ld.so.conf.d/libbpf.conf
sudo ldconfig
BPF Development Tools
# Install bpftrace
sudo apt install -y bpftrace
# Install additional BPF tools
sudo apt install -y \
linux-tools-$(uname -r) \
linux-tools-generic \
bpfcc-tools
# Verify BPF functionality
sudo bpftool prog list
sudo bpftrace -e 'BEGIN { printf("BPF is working!\n"); exit(); }'
Project Setup
Repository Clone
# Clone the repository
git clone https://github.com/DeepShield-AI/DeepTrace.git
cd DeepTrace
# Set up git hooks (optional)
git config core.hooksPath .githooks
chmod +x .githooks/*
Environment Configuration
Create .env file in project root:
# Development environment variables
export RUST_LOG=debug
export RUST_BACKTRACE=1
export DEEPTRACE_LOG_LEVEL=debug
# eBPF development
export BPF_CLANG=clang-15
export BPF_CFLAGS="-O2 -g -Wall -Werror"
# Test configuration
export TEST_ELASTICSEARCH_URL=http://localhost:9200
export TEST_TIMEOUT=300
# Development paths
export CARGO_TARGET_DIR=/tmp/cargo-target
export TMPDIR=/tmp
Load environment variables:
source .env
echo 'source $(pwd)/.env' >> ~/.bashrc
Build System Setup
Initial Build
# Build all components
cargo build --release
# Build specific components
cargo build -p deeptrace-agent --release
cargo build -p deeptrace-server --release
cargo build -p ebpf-common --release
Development Build
# Fast development build
cargo build
# Build with specific features
cargo build --features "debug-logs,test-utils"
# Build for testing
cargo build --tests
eBPF Build Verification
# Test eBPF compilation
cd crates/ebpf-common
cargo build --release
# Verify eBPF object files
ls -la target/release/build/ebpf-common-*/out/
file target/release/build/ebpf-common-*/out/*.o
Testing Environment
Unit Tests Setup
# Run all unit tests
cargo test
# Run specific test suite
cargo test --package deeptrace-agent
cargo test --package ebpf-common
# Run tests with output
cargo test -- --nocapture
Integration Tests Setup
# Deploy test workloads
cd tests/workload/bookinfo
sudo bash deploy.sh
# Run tests
cd tests/workload
python3 test_span_construct.py
# Cleanup
cd bookinfo
sudo bash clear.sh
eBPF Tests Setup
# Run eBPF functionality tests
cd tests/eBPF/functionality
python3 server.py &
python3 client.py
# Run performance overhead tests
cd tests/eBPF/overhead
bash run.sh write
bash run.sh read
bash run.sh sendto
Development Tools
IDE Configuration
Visual Studio Code
Install recommended extensions:
# Install VS Code extensions
code --install-extension rust-lang.rust-analyzer
code --install-extension vadimcn.vscode-lldb
code --install-extension ms-vscode.cpptools
code --install-extension ms-python.python
code --install-extension redhat.vscode-yaml
Create .vscode/settings.json:
{
"rust-analyzer.cargo.target": "x86_64-unknown-linux-gnu",
"rust-analyzer.checkOnSave.command": "clippy",
"rust-analyzer.cargo.features": "all",
"files.watcherExclude": {
"**/target/**": true,
"/tmp/cargo-target/**": true
},
"C_Cpp.default.includePath": [
"/usr/include",
"/usr/local/include",
"/usr/include/x86_64-linux-gnu"
]
}
Create .vscode/launch.json:
{
"version": "0.2.0",
"configurations": [
{
"type": "lldb",
"request": "launch",
"name": "Debug DeepTrace Agent",
"cargo": {
"args": ["build", "--bin=deeptrace-agent"],
"filter": {
"name": "deeptrace-agent",
"kind": "bin"
}
},
"args": ["-f", "config/deeptrace.toml"],
"cwd": "${workspaceFolder}",
"environment": [
{"name": "RUST_LOG", "value": "debug"}
]
}
]
}
Debugging Tools
GDB Setup
# Install GDB with Rust support
sudo apt install -y gdb
# Create .gdbinit
echo 'set auto-load safe-path /' >> ~/.gdbinit
echo 'set print pretty on' >> ~/.gdbinit
Valgrind Setup
# Install Valgrind
sudo apt install -y valgrind
# Run memory check
valgrind --tool=memcheck --leak-check=full \
./target/debug/deeptrace-agent -f config/deeptrace.toml
Performance Profiling
# Install perf tools
sudo apt install -y linux-perf
# Profile application
perf record -g ./target/release/deeptrace-agent -f config/deeptrace.toml
perf report
# CPU profiling with flamegraph
cargo install flamegraph
cargo flamegraph --bin deeptrace-agent -- -f config/deeptrace.toml
Database Setup
Elasticsearch Development
# Start Elasticsearch for development
docker run -d \
--name elasticsearch-dev \
-p 9200:9200 \
-p 9300:9300 \
-e "discovery.type=single-node" \
-e "ES_JAVA_OPTS=-Xms512m -Xmx512m" \
elasticsearch:8.11.0
# Wait for Elasticsearch to start
curl -X GET "localhost:9200/_cluster/health?wait_for_status=yellow&timeout=30s"
# Test Elasticsearch connection
curl -X GET "localhost:9200/_cluster/health"
# Spans will be automatically indexed by the agent
# Index pattern: spans_{agent_name}
Test Database Setup
# Set up test-specific Elasticsearch
docker run -d \
--name elasticsearch-test \
-p 9201:9200 \
-e "discovery.type=single-node" \
-e "ES_JAVA_OPTS=-Xms256m -Xmx256m" \
elasticsearch:8.11.0
# Configure test environment
export TEST_ELASTICSEARCH_URL=http://localhost:9201
Development Workflow
Code Style and Linting
# Format code
cargo fmt
# Run clippy lints
cargo clippy -- -D warnings
# Run additional lints
cargo clippy --all-targets --all-features -- -D warnings
# Check for security vulnerabilities
cargo audit
Pre-commit Hooks
Create .githooks/pre-commit:
#!/bin/bash
set -e
echo "Running pre-commit checks..."
# Format check
if ! cargo fmt -- --check; then
echo "Code formatting issues found. Run 'cargo fmt' to fix."
exit 1
fi
# Clippy check
if ! cargo clippy --all-targets --all-features -- -D warnings; then
echo "Clippy warnings found. Please fix them."
exit 1
fi
# Test check
if ! cargo test --lib; then
echo "Unit tests failed."
exit 1
fi
echo "Pre-commit checks passed!"
Make it executable:
chmod +x .githooks/pre-commit
Development Scripts
Create scripts/dev-setup.sh:
#!/bin/bash
# Set up test environment
# Install required Python packages
pip3 install requests elasticsearch
echo "Setting up DeepTrace development environment..."
# Check prerequisites
check_prerequisites() {
echo "Checking prerequisites..."
# Check kernel version
KERNEL_VERSION=$(uname -r | cut -d. -f1,2)
if (( $(echo "$KERNEL_VERSION < 5.15" | bc -l) )); then
echo "Warning: Kernel version $KERNEL_VERSION is below recommended 5.15"
fi
# Check required commands
for cmd in cargo clang llc bpftool docker; do
if ! command -v $cmd &> /dev/null; then
echo "Error: $cmd is not installed"
exit 1
fi
done
echo "Prerequisites check passed!"
}
# Set up development database
setup_database() {
echo "Setting up development database..."
if ! docker ps | grep -q elasticsearch-dev; then
docker run -d \
--name elasticsearch-dev \
-p 9200:9200 \
-e "discovery.type=single-node" \
-e "ES_JAVA_OPTS=-Xms512m -Xmx512m" \
elasticsearch:8.11.0
echo "Waiting for Elasticsearch to start..."
sleep 30
fi
# Test connection
if curl -s http://localhost:9200/_cluster/health > /dev/null; then
echo "Elasticsearch is running!"
else
echo "Error: Could not connect to Elasticsearch"
exit 1
fi
}
# Build project
build_project() {
echo "Building project..."
# Clean build
cargo clean
# Build all components
cargo build --all
# Run basic tests
cargo test --lib
echo "Build completed successfully!"
}
# Main execution
main() {
check_prerequisites
setup_database
build_project
echo "Development environment setup complete!"
echo "You can now run:"
echo " cd agent && cargo xtask run --release -c config/deeptrace.toml"
echo " cd server && python cli/src/cmd.py agent run"
}
main "$@"
Make it executable:
chmod +x scripts/dev-setup.sh
Troubleshooting
Common Issues
eBPF Compilation Errors
# Check clang version
clang --version
# Verify BPF target support
echo 'int main() { return 0; }' | clang -target bpf -c -x c - -o /tmp/test.o
file /tmp/test.o
# Check kernel headers
ls -la /usr/src/linux-headers-$(uname -r)/
Permission Issues
# Add user to required groups
sudo usermod -a -G docker $USER
sudo usermod -a -G bpf $USER
# Set up BPF permissions
echo 'kernel.unprivileged_bpf_disabled=0' | sudo tee -a /etc/sysctl.conf
sudo sysctl -p
Build Issues
# Clear cargo cache
cargo clean
rm -rf /tmp/cargo-target
# Update dependencies
cargo update
# Check disk space
df -h
Debug Logging
Enable comprehensive debug logging:
# Set environment variables
export RUST_LOG=trace
export RUST_BACKTRACE=full
export DEEPTRACE_LOG_LEVEL=trace
# Run with debug output
cargo run --bin deeptrace-agent -- -f config/deeptrace.toml 2>&1 | tee debug.log
Performance Debugging
# Profile build performance
cargo build --timings
# Check compilation bottlenecks
time cargo build --release
# Monitor system resources
htop
iotop
Best Practices
Development Guidelines
- Code Organization: Keep modules focused and well-documented
- Error Handling: Use proper error types and propagation
- Testing: Write comprehensive unit and integration tests
- Documentation: Document public APIs and complex logic
- Performance: Profile critical paths and optimize bottlenecks
Git Workflow
# Create feature branch
git checkout -b feature/new-feature
# Make changes and commit
git add .
git commit -m "feat: add new feature"
# Push and create PR
git push origin feature/new-feature
Code Review Checklist
- Code follows Rust style guidelines
- All tests pass
- Documentation is updated
- Performance impact is considered
- Security implications are reviewed
- eBPF programs are verified for safety
Release Process
# Update version
cargo edit --version 0.2.0
# Build release
cargo build --release
# Run full test suite
cargo test --release
# Create release tag
git tag -a v0.2.0 -m "Release version 0.2.0"
git push origin v0.2.0
Common Issues
This guide covers the most frequently encountered issues when deploying and operating DeepTrace, along with step-by-step solutions and preventive measures.
Quick Diagnosis Checklist
Before diving into specific issues, run this quick diagnostic checklist:
# 1. Check all containers are running
sudo docker ps | grep -E "(deeptrace|elasticsearch)"
# 2. Verify network connectivity
curl -f http://localhost:7901/health
curl -f http://localhost:9200/_cluster/health
curl -f http://localhost:7899/status
# 3. Check logs for errors
sudo docker logs deeptrace_server --tail 50
sudo docker logs elasticsearch --tail 50
# 4. Verify eBPF programs are loaded
sudo bpftool prog list | grep deeptrace
# 5. Check system resources
free -h
df -h
Installation Issues
1. Docker Installation Failures
Problem: Docker daemon not running
Symptoms:
Cannot connect to the Docker daemon at unix:///var/run/docker.sock
Solution:
# Start Docker service
sudo systemctl start docker
sudo systemctl enable docker
# Verify Docker is running
sudo systemctl status docker
# Test Docker functionality
sudo docker run hello-world
Problem: Permission denied accessing Docker
Symptoms:
permission denied while trying to connect to the Docker daemon socket
Solution:
# Add user to docker group
sudo usermod -aG docker $USER
# Apply group changes
newgrp docker
# Verify access
docker ps
Problem: Docker registry connection issues
Symptoms:
Error response from daemon: Get https://47.97.67.233:5000/v2/: http: server gave HTTP response to HTTPS client
Solution:
# Configure insecure registry
sudo nano /etc/docker/daemon.json
# Add configuration:
{
"insecure-registries": ["47.97.67.233:5000"]
}
# Restart Docker
sudo systemctl restart docker
2. Compilation Errors
Problem: Missing dependencies
Symptoms:
error: failed to run custom build command for `ebpf-common`
clang: error: no such file or directory: '/usr/include/linux/bpf.h'
Solution:
# Install required packages
sudo apt-get update
sudo apt-get install -y \
build-essential \
clang \
llvm-18 \
llvm-18-dev \
libelf-dev \
libclang-18-dev \
linux-headers-$(uname -r)
# Verify installation
clang-18 --version
ls /usr/include/linux/bpf.h
Problem: BTF (BPF Type Format) issues
Symptoms:
libbpf: failed to find valid kernel BTF
libbpf: Error loading vmlinux BTF: -2
Solution:
# Check BTF availability
ls -la /sys/kernel/btf/vmlinux
# If missing, check kernel config
zgrep CONFIG_DEBUG_INFO_BTF /proc/config.gz
# For Ubuntu, install BTF-enabled kernel
sudo apt-get install linux-image-generic-hwe-22.04
# Reboot if kernel was updated
sudo reboot
Problem: Rust compilation errors
Symptoms:
error: linking with `cc` failed: exit status: 1
/usr/bin/ld: cannot find -lbpf: No such file or directory
Solution:
# Install libbpf development libraries
sudo apt-get install libbpf-dev
# Or compile libbpf from source
git clone https://github.com/libbpf/libbpf.git
cd libbpf/src
make
sudo make install
sudo ldconfig
Runtime Issues
3. Agent Connection Problems
Problem: Agent fails to start
Symptoms:
curl http://localhost:7899/status
# curl: (7) Failed to connect to localhost port 7899: Connection refused
Diagnosis:
# Check if agent process is running
ps aux | grep deeptrace
# Check agent logs
sudo docker exec -it deeptrace_server cat /var/log/deeptrace/agent.log
# Verify eBPF programs
sudo bpftool prog list | grep deeptrace
Solution:
# Restart agent
sudo docker exec -it deeptrace_server python -m cli.src.cmd agent stop
sudo docker exec -it deeptrace_server python -m cli.src.cmd agent run
# Check for permission issues
sudo dmesg | grep -i bpf
# Verify kernel version compatibility
uname -r
# Should be 6.8.0 or later
Problem: Agent loses connection to server
Symptoms:
- Agent status shows "disconnected"
- No new spans appearing in Elasticsearch
- Network timeouts in logs
Diagnosis:
# Test network connectivity
telnet localhost 7901
# Check server status
curl http://localhost:7901/health
# Monitor network traffic
sudo netstat -tuln | grep 7901
Solution:
# Check firewall settings
sudo ufw status
sudo iptables -L
# Verify server configuration
sudo docker exec -it deeptrace_server cat /app/config/config.toml
# Restart networking components
sudo docker restart deeptrace_server
4. Data Collection Issues
Problem: No spans being collected
Symptoms:
- Empty Elasticsearch indices
- Zero span count in dashboard
- No eBPF events in logs
Diagnosis:
# Check monitored processes
sudo docker exec -it deeptrace_server python -m cli.src.cmd agent list-processes
# Verify eBPF program attachment
sudo bpftool prog show | grep deeptrace
# Check system call activity
sudo strace -e trace=network -p $(pgrep your-app) -c
Solution:
# Add processes to monitoring
sudo docker exec -it deeptrace_server python -m cli.src.cmd agent add-process --name nginx
# Verify process filtering configuration
sudo docker exec -it deeptrace_server python -m cli.src.cmd config show agents.trace.pids
# Restart with debug logging
RUST_LOG=debug sudo docker exec -it deeptrace_server python -m cli.src.cmd agent run
Problem: Incomplete span data
Symptoms:
- Spans missing payload data
- Incomplete network information
- Missing timing information
Diagnosis:
# Check payload capture settings
curl http://localhost:7899/config | jq '.capture'
# Monitor eBPF map usage
sudo bpftool map show | grep deeptrace
# Check for buffer overflows
dmesg | grep -i "ring buffer"
Solution:
# Increase buffer sizes
sudo docker exec -it deeptrace_server python -m cli.src.cmd config update \
--key "agents.sender.mem_buffer_size" --value 64
# Enable payload compression
sudo docker exec -it deeptrace_server python -m cli.src.cmd config update \
--key "agents.capture.enable_compression" --value true
# Adjust payload limits
sudo docker exec -it deeptrace_server python -m cli.src.cmd config update \
--key "agents.capture.max_payload_size" --value 2048
5. Performance Issues
Problem: High CPU usage
Symptoms:
- System CPU usage > 80%
- Application performance degradation
- High eBPF program execution time
Diagnosis:
# Monitor CPU usage by process
htop
top -p $(pgrep deeptrace)
# Check eBPF program performance
sudo bpftool prog show | grep run_time_ns
# Profile application performance
perf top -p $(pgrep your-app)
Solution:
# Implement sampling
sudo docker exec -it deeptrace_server python -m cli.src.cmd config update \
--key "agents.trace.sampling_rate" --value 0.1
# Reduce payload capture
sudo docker exec -it deeptrace_server python -m cli.src.cmd config update \
--key "agents.capture.max_payload_size" --value 512
# Optimize process filtering
sudo docker exec -it deeptrace_server python -m cli.src.cmd agent remove-process --name unnecessary-process
Problem: High memory usage
Symptoms:
- System memory usage > 90%
- OOM (Out of Memory) errors
- Swap usage increasing
Diagnosis:
# Check memory usage by component
free -h
sudo docker stats
# Monitor Elasticsearch memory
curl http://localhost:9200/_nodes/stats/jvm
# Check for memory leaks
valgrind --tool=massif --pid=$(pgrep deeptrace)
Solution:
# Reduce Elasticsearch heap size
sudo docker exec -it elasticsearch bash -c 'export ES_JAVA_OPTS="-Xms1g -Xmx2g"'
# Implement data retention
curl -X PUT "localhost:9200/_ilm/policy/deeptrace-policy" -H 'Content-Type: application/json' -d'
{
"policy": {
"phases": {
"delete": {
"min_age": "7d"
}
}
}
}'
# Clean old indices
curl -X DELETE "localhost:9200/traces-$(date -d '7 days ago' +%Y.%m.%d)"
6. Elasticsearch Issues
Problem: Elasticsearch cluster health is red
Symptoms:
curl http://localhost:9200/_cluster/health
# {"status":"red","timed_out":false}
Diagnosis:
# Check cluster status details
curl http://localhost:9200/_cluster/health?pretty
# Check node status
curl http://localhost:9200/_cat/nodes?v
# Check shard allocation
curl http://localhost:9200/_cat/shards?v
Solution:
# Restart Elasticsearch
sudo docker restart elasticsearch
# Check disk space
df -h
# Reallocate unassigned shards
curl -X POST "localhost:9200/_cluster/reroute?retry_failed=true"
# If disk space is low, clean old data
curl -X DELETE "localhost:9200/traces-*" -H 'Content-Type: application/json' -d'
{
"query": {
"range": {
"@timestamp": {
"lt": "now-7d"
}
}
}
}'
Problem: Slow query performance
Symptoms:
- Dashboard loading slowly
- Query timeouts
- High Elasticsearch CPU usage
Diagnosis:
# Check slow queries
curl http://localhost:9200/_nodes/stats/indices/search
# Monitor query performance
curl http://localhost:9200/_cat/thread_pool/search?v
# Check index statistics
curl http://localhost:9200/_cat/indices?v&s=store.size:desc
Solution:
# Optimize indices
curl -X POST "localhost:9200/traces-*/_forcemerge?max_num_segments=1"
# Add more replicas for read performance
curl -X PUT "localhost:9200/traces-*/_settings" -H 'Content-Type: application/json' -d'
{
"index": {
"number_of_replicas": 1
}
}'
# Create index templates with optimized mappings
curl -X PUT "localhost:9200/_index_template/traces" -H 'Content-Type: application/json' -d'
{
"index_patterns": ["traces-*"],
"template": {
"settings": {
"number_of_shards": 1,
"number_of_replicas": 0,
"refresh_interval": "30s"
}
}
}'
Correlation and Assembly Issues
7. Poor Correlation Results
Problem: Low correlation accuracy
Symptoms:
- Traces with missing spans
- Incorrect parent-child relationships
- Fragmented traces
Diagnosis:
# Check correlation statistics
sudo docker exec -it deeptrace_server python -m cli.src.cmd asso stats
# Analyze correlation parameters
sudo docker exec -it deeptrace_server python -m cli.src.cmd asso config show
# Review sample traces
curl "http://localhost:9200/traces/_search?size=10&pretty"
Solution:
# Adjust correlation window
sudo docker exec -it deeptrace_server python -m cli.src.cmd asso config --window 2000
# Lower similarity threshold
sudo docker exec -it deeptrace_server python -m cli.src.cmd asso config --threshold 0.6
# Try different algorithm
sudo docker exec -it deeptrace_server python -m cli.src.cmd asso algo fifo
# Enable debug mode
sudo docker exec -it deeptrace_server python -m cli.src.cmd asso config --debug
Problem: Correlation timeouts
Symptoms:
- Correlation process hangs
- High CPU usage during correlation
- Memory exhaustion
Diagnosis:
# Monitor correlation process
ps aux | grep correlation
htop -p $(pgrep correlation)
# Check memory usage
free -h
sudo docker stats deeptrace_server
Solution:
# Increase timeout values
sudo docker exec -it deeptrace_server python -m cli.src.cmd asso config --timeout 300
# Process in smaller batches
sudo docker exec -it deeptrace_server python -m cli.src.cmd asso config --batch-size 1000
# Add more memory to container
sudo docker update --memory 4g deeptrace_server
Network and Connectivity Issues
8. Port Conflicts
Problem: Port already in use
Symptoms:
Error starting userland proxy: listen tcp 0.0.0.0:7901: bind: address already in use
Diagnosis:
# Check what's using the port
sudo netstat -tuln | grep 7901
sudo lsof -i :7901
# Find the process
sudo fuser 7901/tcp
Solution:
# Kill conflicting process
sudo fuser -k 7901/tcp
# Or change DeepTrace port
sudo docker exec -it deeptrace_server python -m cli.src.cmd config update \
--key "server.port" --value 7902
# Restart with new configuration
sudo docker restart deeptrace_server
9. SSL/TLS Issues
Problem: Certificate validation errors
Symptoms:
SSL certificate problem: self signed certificate
Solution:
# For development, disable SSL verification
curl -k https://localhost:7901/health
# For production, install proper certificates
sudo docker exec -it deeptrace_server python -m cli.src.cmd cert install \
--cert /path/to/cert.pem \
--key /path/to/key.pem
Monitoring and Alerting
10. Setting Up Health Checks
Create monitoring scripts to detect issues early:
#!/bin/bash
# health-check.sh
# Check all services
services=("deeptrace_server:7901" "elasticsearch:9200" "agent:7899")
for service in "${services[@]}"; do
name=$(echo $service | cut -d: -f1)
port=$(echo $service | cut -d: -f2)
if ! curl -f -s http://localhost:$port/health > /dev/null; then
echo "ALERT: $name is not responding on port $port"
# Send alert (email, Slack, etc.)
fi
done
# Check disk space
disk_usage=$(df / | tail -1 | awk '{print $5}' | sed 's/%//')
if [ $disk_usage -gt 80 ]; then
echo "ALERT: Disk usage is ${disk_usage}%"
fi
# Check memory usage
mem_usage=$(free | grep Mem | awk '{printf "%.0f", $3/$2 * 100.0}')
if [ $mem_usage -gt 80 ]; then
echo "ALERT: Memory usage is ${mem_usage}%"
fi
11. Log Analysis
Set up centralized logging for better troubleshooting:
# Collect all logs
sudo docker logs deeptrace_server > deeptrace-server.log 2>&1
sudo docker logs elasticsearch > elasticsearch.log 2>&1
dmesg | grep -i bpf > kernel-bpf.log
# Analyze error patterns
grep -i error *.log
grep -i "failed\|timeout\|exception" *.log
# Monitor real-time logs
sudo docker logs -f deeptrace_server | grep -E "(ERROR|WARN|FATAL)"
Prevention Strategies
1. Regular Maintenance
#!/bin/bash
# maintenance.sh - Run weekly
# Clean old data
curl -X DELETE "localhost:9200/traces-$(date -d '30 days ago' +%Y.%m.%d)"
# Optimize indices
curl -X POST "localhost:9200/traces-*/_forcemerge?max_num_segments=1"
# Update system packages
sudo apt-get update && sudo apt-get upgrade -y
# Restart services
sudo docker restart deeptrace_server elasticsearch
2. Capacity Planning
Monitor these metrics regularly:
- CPU Usage: Keep below 70% average
- Memory Usage: Keep below 80% average
- Disk Usage: Keep below 75% average
- Network Bandwidth: Monitor for saturation
- Elasticsearch Heap: Keep below 75% of allocated memory
3. Backup Strategy
#!/bin/bash
# backup.sh - Run daily
# Backup Elasticsearch data
curl -X PUT "localhost:9200/_snapshot/backup/snapshot_$(date +%Y%m%d)" -H 'Content-Type: application/json' -d'
{
"indices": "traces-*",
"ignore_unavailable": true,
"include_global_state": false
}'
# Backup configuration
sudo docker exec deeptrace_server tar -czf /backup/config-$(date +%Y%m%d).tar.gz /app/config/
Debugging Guide
This comprehensive debugging guide helps you diagnose and resolve issues with DeepTrace components. It covers systematic troubleshooting approaches, diagnostic tools, and common problem resolution strategies.
Debugging Methodology
1. Problem Identification
Start with these key questions:
- What is the expected behavior?
- What is the actual behavior?
- When did the problem start?
- What changed recently?
- Is the problem consistent or intermittent?
2. Information Gathering
Collect relevant information systematically:
# System information
uname -a
cat /etc/os-release
free -h
df -h
# DeepTrace version
deeptrace-agent --version
deeptrace-server --version
# Process status
ps aux | grep deeptrace
systemctl status deeptrace-agent
systemctl status deeptrace-server
3. Log Analysis
Enable comprehensive logging:
# agent.toml
[logging]
level = "debug"
format = "json"
output = "file"
file_path = "/var/log/deeptrace/agent-debug.log"
# server.toml
[logging]
level = "debug"
format = "json"
output = "file"
file_path = "/var/log/deeptrace/server-debug.log"
Component-Specific Debugging
Agent Debugging
eBPF Program Issues
Check eBPF Support:
# Verify kernel version
uname -r
# Check eBPF filesystem
ls -la /sys/fs/bpf/
# Verify BPF capabilities
grep CONFIG_BPF /boot/config-$(uname -r)
Debug Program Loading:
# Enable eBPF debug logging
echo 1 > /proc/sys/kernel/bpf_stats_enabled
# Check loaded programs
sudo bpftool prog list | grep deeptrace
# Monitor kernel messages
sudo dmesg -w | grep bpf
# Check program verification logs
journalctl -f | grep bpf
Common eBPF Errors:
-
BTF_KIND:0 Error
# Check BTF availability ls -la /sys/kernel/btf/vmlinux # Verify BTF format bpftool btf dump file /sys/kernel/btf/vmlinux | head -20 # Fallback to non-CO-RE mode export DEEPTRACE_EBPF_ENABLE_CO_RE=false -
Permission Denied
# Check capabilities getcap /usr/bin/deeptrace-agent # Add required capabilities sudo setcap cap_sys_admin,cap_bpf+ep /usr/bin/deeptrace-agent # Or run with sudo (not recommended for production) sudo deeptrace-agent --config agent.toml -
Program Too Large
# Check program size limits cat /proc/sys/kernel/bpf_jit_limit # Increase limit if needed echo 1000000000 | sudo tee /proc/sys/kernel/bpf_jit_limit
Span Collection Issues
Debug Span Collection:
# Enable span collection debugging
curl -X POST http://localhost:7899/config \
-H "Content-Type: application/json" \
-d '{"logging": {"level": "trace"}}'
# Monitor span collection rate
watch -n 1 'curl -s http://localhost:7899/status | jq .collection.spans_per_second'
# Check process filtering
curl http://localhost:7899/processes | jq '.processes[] | select(.status == "monitored")'
Span Collection Troubleshooting:
#!/usr/bin/env python3
# debug_span_collection.py
import requests
import time
import json
def debug_span_collection():
agent_url = "http://localhost:7899"
# Get agent status
status = requests.get(f"{agent_url}/status").json()
print(f"Agent Status: {status['agent']['status']}")
print(f"eBPF Programs: {status['ebpf']['programs_loaded']}")
print(f"Spans Collected: {status['collection']['spans_collected']}")
# Check monitored processes
processes = requests.get(f"{agent_url}/processes").json()
monitored = [p for p in processes['processes'] if p['status'] == 'monitored']
print(f"Monitored Processes: {len(monitored)}")
for proc in monitored[:5]: # Show first 5
print(f" PID {proc['pid']}: {proc['name']} ({proc['spans_collected']} spans)")
# Monitor span rate
print("\nMonitoring span collection rate...")
prev_count = status['collection']['spans_collected']
time.sleep(10)
new_status = requests.get(f"{agent_url}/status").json()
new_count = new_status['collection']['spans_collected']
rate = (new_count - prev_count) / 10
print(f"Span Rate: {rate:.2f} spans/second")
if rate == 0:
print("WARNING: No spans being collected!")
print("Check:")
print("- eBPF programs are loaded")
print("- Processes are being monitored")
print("- Network activity is occurring")
if __name__ == "__main__":
debug_span_collection()
Network Communication Issues
Debug Server Communication:
# Test server connectivity
curl -v http://localhost:7901/health
# Check agent-server communication
tcpdump -i any -n port 7901
# Monitor failed requests
curl http://localhost:7899/metrics | grep failed_requests
# Check retry queue
curl http://localhost:7899/status | jq .sender.retry_queue_size
Server Debugging
Elasticsearch Issues
Debug Elasticsearch Connection:
# Check Elasticsearch health
curl http://localhost:9200/_cluster/health?pretty
# Verify indices
curl http://localhost:9200/_cat/indices/deeptrace*
# Check index mappings
curl http://localhost:9200/deeptrace-spans/_mapping?pretty
# Monitor indexing performance
curl http://localhost:9200/_cat/thread_pool/write?v
Elasticsearch Troubleshooting Script:
#!/usr/bin/env python3
# debug_elasticsearch.py
import requests
import json
from datetime import datetime, timedelta
def debug_elasticsearch():
es_url = "http://localhost:9200"
try:
# Check cluster health
health = requests.get(f"{es_url}/_cluster/health").json()
print(f"Cluster Status: {health['status']}")
print(f"Active Shards: {health['active_shards']}")
print(f"Unassigned Shards: {health['unassigned_shards']}")
# Check indices
indices = requests.get(f"{es_url}/_cat/indices/deeptrace*?format=json").json()
print(f"\nDeepTrace Indices: {len(indices)}")
for idx in indices:
print(f" {idx['index']}: {idx['docs.count']} docs, {idx['store.size']}")
# Check recent documents
query = {
"query": {
"range": {
"timestamp": {
"gte": "now-1h"
}
}
},
"size": 0
}
result = requests.get(
f"{es_url}/deeptrace-spans/_search",
json=query
).json()
recent_docs = result['hits']['total']['value']
print(f"\nRecent Documents (1h): {recent_docs}")
if recent_docs == 0:
print("WARNING: No recent documents found!")
print("Check:")
print("- Agent is sending data")
print("- Index template is correct")
print("- No indexing errors")
except Exception as e:
print(f"ERROR: Cannot connect to Elasticsearch: {e}")
print("Check:")
print("- Elasticsearch is running")
print("- Network connectivity")
print("- Authentication credentials")
if __name__ == "__main__":
debug_elasticsearch()
Correlation Engine Issues
Debug Correlation Process:
# Check correlation status
curl http://localhost:7901/status | jq .correlation
# Monitor correlation jobs
curl http://localhost:7901/correlation/jobs
# Check algorithm performance
curl http://localhost:7901/analytics/services | jq '.services[] | {name, request_count, error_rate}'
Correlation Debugging:
#!/usr/bin/env python3
# debug_correlation.py
import requests
import json
from datetime import datetime, timedelta
def debug_correlation():
server_url = "http://localhost:7901"
# Get server status
status = requests.get(f"{server_url}/status").json()
correlation = status['correlation']
print(f"Correlation Algorithm: {correlation['algorithm']}")
print(f"Spans Processed: {correlation['spans_processed']}")
print(f"Traces Generated: {correlation['traces_generated']}")
print(f"Correlation Rate: {correlation['correlation_rate']:.2f}%")
# Check for recent traces
traces = requests.get(f"{server_url}/traces?limit=10").json()
print(f"\nRecent Traces: {len(traces['traces'])}")
if len(traces['traces']) == 0:
print("WARNING: No traces found!")
print("Check:")
print("- Spans are being received")
print("- Correlation is running")
print("- Algorithm parameters")
# Analyze trace quality
for trace in traces['traces'][:3]:
print(f"\nTrace {trace['trace_id']}:")
print(f" Spans: {trace['span_count']}")
print(f" Services: {trace['service_count']}")
print(f" Duration: {trace['duration']}ms")
print(f" Has Errors: {trace['has_errors']}")
if __name__ == "__main__":
debug_correlation()
Advanced Debugging Techniques
Performance Profiling
CPU Profiling
# Profile agent CPU usage
perf record -g -p $(pgrep deeptrace-agent) -- sleep 30
perf report
# Profile server CPU usage
perf record -g -p $(pgrep deeptrace-server) -- sleep 30
perf report
# Generate flame graphs
git clone https://github.com/brendangregg/FlameGraph
perf record -g -p $(pgrep deeptrace-agent) -- sleep 30
perf script | ./FlameGraph/stackcollapse-perf.pl | ./FlameGraph/flamegraph.pl > agent-flamegraph.svg
Memory Profiling
# Profile memory usage with Valgrind
valgrind --tool=massif --massif-out-file=agent.massif ./deeptrace-agent --config agent.toml
ms_print agent.massif > agent-memory-profile.txt
# Monitor memory usage over time
while true; do
echo "$(date): $(ps -p $(pgrep deeptrace-agent) -o rss= | awk '{print $1/1024 " MB"}')"
sleep 60
done
Network Profiling
# Monitor network traffic
sudo tcpdump -i any -w deeptrace-traffic.pcap host localhost and port 7901
# Analyze with Wireshark
wireshark deeptrace-traffic.pcap
# Monitor bandwidth usage
iftop -i any -f "port 7901"
eBPF Debugging
BPF Program Analysis
# Dump loaded programs
sudo bpftool prog dump xlated id $(sudo bpftool prog list | grep deeptrace | awk '{print $1}' | head -1)
# Show program statistics
sudo bpftool prog show --json | jq '.[] | select(.name | contains("deeptrace"))'
# Monitor map usage
sudo bpftool map show --json | jq '.[] | select(.name | contains("deeptrace"))'
Custom eBPF Debugging
// debug_ebpf.c - Custom debugging program
#include <linux/bpf.h>
#include <bpf/bpf_helpers.h>
struct {
__uint(type, BPF_MAP_TYPE_RINGBUF);
__uint(max_entries, 256 * 1024);
} debug_events SEC(".maps");
struct debug_event {
__u64 timestamp;
__u32 pid;
__u32 event_type;
char comm[16];
};
SEC("kprobe/tcp_sendmsg")
int debug_tcp_sendmsg(struct pt_regs *ctx) {
struct debug_event *event;
event = bpf_ringbuf_reserve(&debug_events, sizeof(*event), 0);
if (!event)
return 0;
event->timestamp = bpf_ktime_get_ns();
event->pid = bpf_get_current_pid_tgid() >> 32;
event->event_type = 1; // TCP_SENDMSG
bpf_get_current_comm(&event->comm, sizeof(event->comm));
bpf_ringbuf_submit(event, 0);
return 0;
}
char LICENSE[] SEC("license") = "GPL";
Log Analysis Tools
Structured Log Analysis
#!/usr/bin/env python3
# analyze_logs.py
import json
import sys
from collections import defaultdict, Counter
from datetime import datetime
def analyze_logs(log_file):
errors = []
warnings = []
events = defaultdict(int)
with open(log_file, 'r') as f:
for line in f:
try:
log_entry = json.loads(line.strip())
level = log_entry.get('level', '').upper()
message = log_entry.get('message', '')
timestamp = log_entry.get('timestamp', '')
if level == 'ERROR':
errors.append((timestamp, message))
elif level == 'WARN':
warnings.append((timestamp, message))
# Count events by type
if 'event_type' in log_entry:
events[log_entry['event_type']] += 1
except json.JSONDecodeError:
continue
print(f"Log Analysis Results:")
print(f"Errors: {len(errors)}")
print(f"Warnings: {len(warnings)}")
print(f"Event Types: {dict(events)}")
if errors:
print("\nRecent Errors:")
for timestamp, message in errors[-5:]:
print(f" {timestamp}: {message}")
if warnings:
print("\nRecent Warnings:")
for timestamp, message in warnings[-5:]:
print(f" {timestamp}: {message}")
if __name__ == "__main__":
if len(sys.argv) != 2:
print("Usage: python3 analyze_logs.py <log_file>")
sys.exit(1)
analyze_logs(sys.argv[1])
Real-time Log Monitoring
#!/bin/bash
# monitor_logs.sh
LOG_FILE="/var/log/deeptrace/agent.log"
ERROR_COUNT=0
WARNING_COUNT=0
tail -f "$LOG_FILE" | while read line; do
if echo "$line" | grep -q '"level":"ERROR"'; then
ERROR_COUNT=$((ERROR_COUNT + 1))
echo "ERROR [$ERROR_COUNT]: $line" | jq -r '.message'
# Alert on high error rate
if [ $ERROR_COUNT -gt 10 ]; then
echo "ALERT: High error rate detected!"
# Send notification
curl -X POST "$SLACK_WEBHOOK" -d "{\"text\":\"DeepTrace high error rate: $ERROR_COUNT errors\"}"
fi
elif echo "$line" | grep -q '"level":"WARN"'; then
WARNING_COUNT=$((WARNING_COUNT + 1))
echo "WARNING [$WARNING_COUNT]: $line" | jq -r '.message'
fi
done
Debugging Checklists
Agent Not Collecting Spans
- eBPF programs loaded successfully
- Processes are being monitored
- Network activity is occurring
- Ring buffer is not full
- Process filters are correct
- Protocol filters are appropriate
- Sufficient privileges (CAP_BPF or root)
- Kernel version compatibility
Server Not Receiving Spans
- Agent can connect to server
- Server is listening on correct port
- Network connectivity between agent and server
- Authentication is configured correctly
- Server has sufficient resources
- Elasticsearch is accessible
- No firewall blocking traffic
Correlation Not Working
- Spans are being received by server
- Correlation algorithm is running
- Algorithm parameters are appropriate
- Sufficient spans for correlation
- Time synchronization between hosts
- Elasticsearch indices are healthy
- No correlation engine errors
Poor Performance
- Resource usage within limits
- eBPF programs are optimized
- Batch sizes are appropriate
- Network latency is acceptable
- Elasticsearch is tuned properly
- Sampling is configured if needed
- No memory leaks detected
Emergency Procedures
Service Recovery
#!/bin/bash
# emergency_recovery.sh
echo "DeepTrace Emergency Recovery"
echo "=========================="
# Stop services
echo "Stopping services..."
systemctl stop deeptrace-agent
systemctl stop deeptrace-server
# Clear problematic state
echo "Clearing state..."
rm -f /tmp/deeptrace-agent.pid
rm -f /tmp/deeptrace-server.pid
rm -rf /tmp/deeptrace-buffers/*
# Reset eBPF state
echo "Resetting eBPF state..."
for prog in $(bpftool prog list | grep deeptrace | awk '{print $1}'); do
bpftool prog detach id $prog
done
# Restart with minimal configuration
echo "Starting with minimal config..."
cp /etc/deeptrace/agent.toml /etc/deeptrace/agent.toml.backup
cp /etc/deeptrace/minimal-agent.toml /etc/deeptrace/agent.toml
systemctl start deeptrace-server
sleep 5
systemctl start deeptrace-agent
echo "Recovery complete. Check status with:"
echo " systemctl status deeptrace-agent"
echo " systemctl status deeptrace-server"
Data Recovery
#!/bin/bash
# recover_data.sh
BACKUP_DIR="/backup/deeptrace"
ES_URL="http://localhost:9200"
echo "DeepTrace Data Recovery"
echo "====================="
# Check Elasticsearch status
if ! curl -s "$ES_URL/_cluster/health" > /dev/null; then
echo "ERROR: Elasticsearch not accessible"
exit 1
fi
# List available backups
echo "Available backups:"
ls -la "$BACKUP_DIR"
read -p "Enter backup date (YYYY-MM-DD): " BACKUP_DATE
if [ -f "$BACKUP_DIR/deeptrace-$BACKUP_DATE.json" ]; then
echo "Restoring data from $BACKUP_DATE..."
# Restore indices
curl -X POST "$ES_URL/_bulk" \
-H "Content-Type: application/json" \
--data-binary "@$BACKUP_DIR/deeptrace-$BACKUP_DATE.json"
echo "Data recovery complete"
else
echo "ERROR: Backup file not found"
exit 1
fi
This debugging guide provides comprehensive tools and procedures for diagnosing and resolving DeepTrace issues. Use it systematically to identify root causes and implement effective solutions.
Log Analysis
Performance Issues
Glossary
Frequently Asked Questions (FAQ)
This FAQ addresses common questions about DeepTrace, covering installation, configuration, usage, and troubleshooting.
General Questions
What is DeepTrace?
Q: What makes DeepTrace different from other distributed tracing solutions?
A: DeepTrace is unique in several ways:
- Non-intrusive: No code changes required in your applications
- eBPF-based: Uses kernel-level instrumentation for comprehensive monitoring
- Transaction-aware: Uses intelligent correlation based on application semantics
- Protocol-agnostic: Supports 20+ protocols out of the box
- High accuracy: Achieves >95% tracing accuracy even under high concurrency
What are the system requirements?
Q: What operating systems and kernel versions does DeepTrace support?
A: DeepTrace requires:
- OS: Ubuntu 24.04 LTS (or compatible Linux distribution)
- Kernel: 6.8.0+ with eBPF and BTF support
- Memory: 4GB minimum, 8GB recommended
- Storage: 40GB+ free space
- CPU: 2+ cores recommended
How does DeepTrace compare to Jaeger, Zipkin, or other solutions?
Q: Should I use DeepTrace instead of Jaeger/Zipkin?
A: DeepTrace complements traditional tracing solutions:
| Feature | DeepTrace | Jaeger/Zipkin |
|---|---|---|
| Code Changes | None required | Manual instrumentation |
| Protocol Support | 20+ protocols | Application-dependent |
| Correlation | AI-based semantic correlation | Manual span linking |
| Overhead | 2-5% | 1-3% |
| Accuracy | >95% | Depends on instrumentation |
Use DeepTrace when you need comprehensive tracing without code changes, or alongside existing solutions for enhanced visibility.
Installation and Setup
Can I install DeepTrace without Docker?
Q: Is Docker required for DeepTrace installation?
A: While Docker is the recommended installation method, you can compile DeepTrace manually:
- Follow the Manual Compilation Guide
- Requires Rust toolchain, LLVM, and libbpf
- More complex but provides full control over the build process
Why do I need privileged access?
Q: Why does DeepTrace require root/sudo privileges?
A: DeepTrace needs elevated privileges for:
- eBPF program loading: Requires
CAP_BPFandCAP_SYS_ADMINcapabilities - System call monitoring: Needs access to kernel tracepoints
- Network interface access: Monitors network traffic at kernel level
- Process monitoring: Accesses process information and file descriptors
Can I run DeepTrace in Kubernetes?
Q: How do I deploy DeepTrace in a Kubernetes cluster?
A: Yes, DeepTrace supports Kubernetes deployment:
- Deploy agents as DaemonSet on each node
- Run server as Deployment with multiple replicas
- Use ConfigMaps for configuration management
- Refer to the Kubernetes deployment examples
Configuration and Usage
How do I monitor specific applications?
Q: Can I choose which applications to monitor?
A: Yes, DeepTrace provides flexible filtering options:
[agents.trace]
# Monitor specific processes by PID
pids = [1234, 5678]
# Monitor by process name
include_processes = ["nginx", "redis-server", "app-server"]
exclude_processes = ["systemd", "kernel"]
# Monitor all Docker containers (default)
monitor_containers = true
What protocols does DeepTrace support?
Q: Which application protocols can DeepTrace trace?
A: DeepTrace currently supports:
- Web: HTTP/1.1, HTTP/2, gRPC
- Databases: MySQL, PostgreSQL, MongoDB, Redis
- Message Queues: RabbitMQ, Apache Kafka (planned)
- Cache: Redis, Memcached
- Custom: Extensible protocol detection
How accurate is the correlation?
Q: How reliable are the trace correlations?
A: DeepTrace achieves high correlation accuracy:
- >95% accuracy in typical microservices environments
- Transaction-based correlation using API semantics
- Multiple algorithms available for different scenarios
- Confidence scoring for each correlation decision
You can tune correlation parameters based on your specific environment.
Performance and Overhead
What is the performance impact?
Q: How much overhead does DeepTrace add to my applications?
A: DeepTrace is designed for minimal impact:
- CPU Overhead: 2-5% under normal load
- Memory Usage: 50-200MB per agent
- Network Latency: <1μs additional latency
- Throughput Impact: <3% reduction in peak throughput
See the Performance Analysis for detailed measurements.
Can I reduce the overhead further?
Q: How can I minimize DeepTrace's performance impact?
A: Several optimization strategies:
-
Implement sampling:
[agents.trace] sampling_rate = 0.1 # Sample 10% of requests -
Reduce payload capture:
[agents.capture] max_payload_size = 512 enable_compression = true -
Filter processes:
[agents.trace] include_processes = ["critical-service-only"]
Does DeepTrace affect application startup time?
Q: Will DeepTrace slow down application startup?
A: No, DeepTrace has minimal impact on application startup:
- eBPF programs load independently of applications
- No application code modification required
- Monitoring begins after applications are already running
Troubleshooting
Why am I not seeing any traces?
Q: DeepTrace is running but no traces appear in the dashboard.
A: Check these common issues:
-
Verify agent is collecting data:
curl http://localhost:7899/status -
Check process filtering:
sudo docker exec -it deeptrace_server python -m cli.src.cmd agent list-processes -
Verify eBPF programs are loaded:
sudo bpftool prog list | grep deeptrace -
Check Elasticsearch connectivity:
curl http://localhost:9200/_cluster/health
Why are my traces incomplete?
Q: I see spans but traces are fragmented or missing spans.
A: This usually indicates correlation issues:
-
Adjust correlation parameters:
sudo docker exec -it deeptrace_server python -m cli.src.cmd asso config --window 2000 -
Try different correlation algorithm:
sudo docker exec -it deeptrace_server python -m cli.src.cmd asso algo fifo -
Check for high load conditions:
- High CPU usage can cause span drops
- Network issues can cause transmission delays
How do I debug eBPF issues?
Q: My eBPF programs aren't loading or working correctly.
A: Debug eBPF issues systematically:
-
Check kernel compatibility:
uname -r # Should be 6.8.0+ ls /sys/kernel/btf/vmlinux # BTF should exist -
Verify eBPF support:
zgrep CONFIG_BPF /proc/config.gz zgrep CONFIG_BPF_SYSCALL /proc/config.gz -
Check for errors in kernel logs:
dmesg | grep -i bpf -
Use bpftool for debugging:
sudo bpftool prog list sudo bpftool map list
Data Management
How long is trace data retained?
Q: How long does DeepTrace keep trace data?
A: Data retention is configurable:
- Default: 7 days
- Configurable: Set retention policies in Elasticsearch
- Automatic cleanup: Old indices are automatically deleted
- Manual cleanup: Use provided cleanup scripts
Can I export trace data?
Q: How do I export traces for analysis or backup?
A: Yes, multiple export options are available:
# Export to JSON
sudo docker exec -it deeptrace_server python -m cli.src.cmd export \
--format json --output traces.json
# Export specific time range
sudo docker exec -it deeptrace_server python -m cli.src.cmd export \
--start "2024-01-01T00:00:00Z" --end "2024-01-02T00:00:00Z"
# Elasticsearch snapshot
curl -X PUT "localhost:9200/_snapshot/backup/snapshot_1"
How do I backup DeepTrace data?
Q: What's the recommended backup strategy?
A: Implement a comprehensive backup strategy:
-
Configuration backup:
tar -czf config-backup.tar.gz /app/config/ -
Elasticsearch snapshots:
curl -X PUT "localhost:9200/_snapshot/backup/daily_$(date +%Y%m%d)" -
Automated backup script:
# Run daily via cron 0 2 * * * /path/to/backup-deeptrace.sh
Security and Privacy
Is trace data encrypted?
Q: How does DeepTrace protect sensitive data?
A: DeepTrace implements multiple security layers:
- Encryption in transit: TLS for all communications
- Encryption at rest: Elasticsearch encryption support
- Access control: Role-based access control (RBAC)
- Data sanitization: Configurable payload filtering
Can I filter sensitive data?
Q: How do I prevent sensitive information from being captured?
A: Configure data filtering:
[agents.capture]
# Disable payload capture for sensitive services
exclude_payloads = ["payment-service", "auth-service"]
# Filter sensitive headers
filter_headers = ["Authorization", "X-API-Key"]
# Mask sensitive fields
mask_patterns = ["password", "ssn", "credit_card"]
Does DeepTrace comply with privacy regulations?
Q: Is DeepTrace GDPR/CCPA compliant?
A: DeepTrace provides tools for compliance:
- Data minimization: Capture only necessary data
- Right to erasure: Delete specific user data
- Data portability: Export user-specific traces
- Audit logging: Track all data access
Consult with your legal team for specific compliance requirements.
Advanced Usage
Can I extend DeepTrace with custom protocols?
Q: How do I add support for a custom protocol?
A: Yes, DeepTrace is extensible:
-
Implement protocol detector:
#![allow(unused)] fn main() { pub fn detect_custom_protocol(payload: &[u8]) -> bool { // Custom protocol detection logic } } -
Add protocol parser:
#![allow(unused)] fn main() { pub fn parse_custom_protocol(payload: &[u8]) -> ProtocolMetadata { // Custom parsing logic } } -
Register with DeepTrace:
#![allow(unused)] fn main() { register_protocol_handler("custom", detect_custom_protocol, parse_custom_protocol); }
Can I integrate DeepTrace with other monitoring tools?
Q: How do I integrate DeepTrace with Prometheus, Grafana, etc.?
A: DeepTrace supports multiple integration methods:
- Metrics export: Prometheus-compatible metrics endpoint
- Grafana dashboards: Pre-built dashboard templates
- API integration: REST API for custom integrations
- Webhook notifications: Real-time alerts and notifications
How do I contribute to DeepTrace?
Q: I want to contribute code or report bugs. How do I get involved?
A: We welcome contributions:
- GitHub Repository: DeepShield-AI/DeepTrace
- Issue Reporting: Use GitHub Issues for bugs and feature requests
- Development Guide: See Contributing Guide
- Community: Join our discussions and community channels
If your question isn't answered here, please check the detailed documentation sections or reach out to the community through our GitHub repository.